For the first time in human history, the time required to explore all the combinations of analyzes we make available to the management is much longer than the time required to build all of these combinations !

Due to the dynamic flexibility that Qlik™ has and the systemic and systematic approach that QQinfo know-how offers, the number of analysis variants that we can build for the beneficiary management reaches astronomical levels! And it’s not an understatement! (More information can be found out below in the details about QQreport.builder™).
Thus, many of the situations in which the management identifies the need for a new analysis perspective are already pre-resolved needs before they are expressed.
The reuse of complex processing and visualization modules from QQinfo, with virtually zero costs for the beneficiary (we charge only for the application of the model in the context of the beneficiary and for any necessary adaptations), brings the benefits of using the Qlik™ platform closer to reality, offering shorter implementation times and keeps implementation costs even lower.
QQreport.builder™ brings an astronomical number of available combinations.
In more sophisticated contexts, where the number of possible measures and dimensions in total increases by over 20, the number of possible combinations (in any number) between these dimensions and sizes immediately increases to huge numbers, even astronomical !
Let’s take an extremely plausible example: a set of 10 non-temporal dimensions, 7 temporal dimensions and 6 value quantities, the total possible number reaches permutations of 23 taken 2,3,4,5…23, cumulative, i.e. 70 thousands billions of billions of possible combinations (comparable to the number of stars in the visible universe or the number of atoms on planet Earth!).
Here is the specifications that led us to the astronomical number presented above:
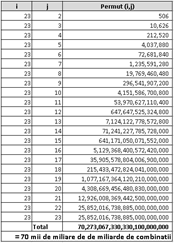
Note: The calculations were made for a straight table with a maximum of 23 columns, which has a single view form, and which ignored any dynamic temporary filtering or comparative interconnection formulas, or other contextual alternatives, such as view currency, audience type, selective filtering of information, or other additional graphical view alternatives.
1 thought on “QQinfo multiplies the power of Qlik™ to cosmic dimensions”