Copy value to clipboard – the new Qlik Sense™ June 2019 release makes it possible to copy values from tables to clipboard. This is an improvement that will increase productivity and reduce several steps when reusing values from a Qlik Sense™ application.
Grid layout on mobile devices – app developers can choose the rendering layout for sheets on small screens (like tablets and mobile phones). List view is still the default option showing only the visualization titles.
The new Grid view shows a small preview of the visualizations, reducing this way the white space from the screen. This way, developers have more control over how their apps for mobile are displayed.
– Changing the small screen layout
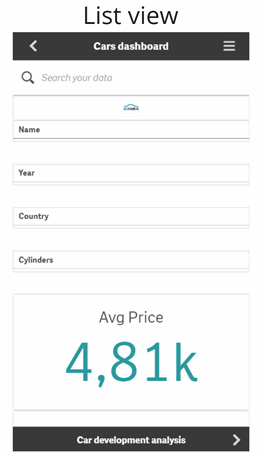
Sheets are displayed in List viewed on small screens (by default). The new Qlik Sense™ June 2019 allows to change them to display as a grid (sheets must be set to responsive layout to display as grid on small screens).
SHEET VIEWED ON A SMALL SCREEN IN LIST VIEW
SHEET VIEWED ON A SMALL SCREEN IN GRID VIEW
Grid view shows a small preview of your visualizations. list view only shows the visualization titles.
Native container object – the Qlik Sense™ June 2019 release brings the first ever release of a native Container object. This first release will not support Qlik NPrinting™, but it’s planned for future releases.
With the release of the native container object, current applications using the existing extension objects will continue to work as before, but the two Container Object extensions will no longer be listed as new object options for applications.
– Container
The container is an object that lets you to add visualizations in a limited space. You can also show or hide the visualizations inside the container based on conditions. It is useful when you want to switch quickly between different visualizations, on a dashboard with limited screen real estate. The container can be use as well to show different visualizations based on:
– which user is accessing the chart; – the value of a variable; – possible number of values in a field, by using the GetPossibleCount() function in the condition expression.
Visualizations and Mapping
New charts for the Visualization Bundle
– Trellis Container – makes small multiples of a master visualization.
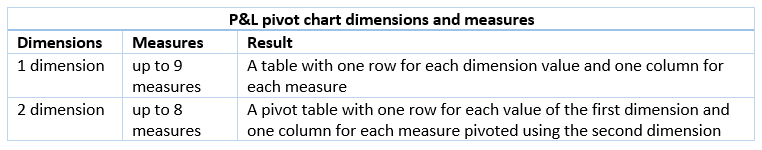
– P&L Pivot Chart – it’s a pivot table with customization options for easier creation of financial reports (such as profit and loss statements).
You can use P&L pivot chart extension to create a pivot table with a layout for profit and loss reporting. You can color cells according to performance and style the chart with custom fonts and alternating row colors. You can also export the chart to Excel including formatting. The P&L pivot chart is included in the Visualization bundle.
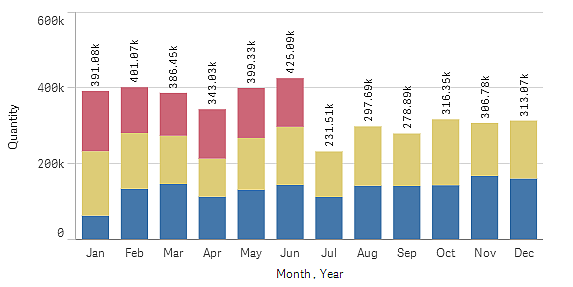
Improved Bar Chart
Labels on stacked bars;
Improved tooltip for stacked bars now displays positive an negative totals;
Cut bars also for stacked bars;
You can create a chart with measures only, without dimension;
Styling options for the number of bars: auto, all or fixed number;
Styling options for stroke color, width and bar width;
Toggle mini chart for all scales, not just for continuous axis.
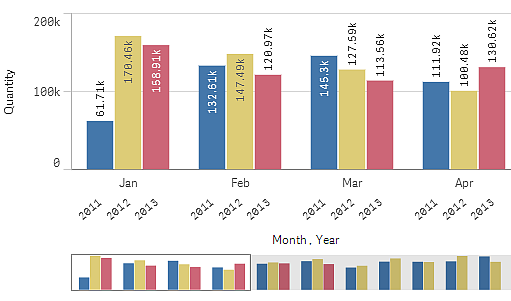
Grouped Bars: with grouped bars, you can easily compare two or more items in the same categorical group.
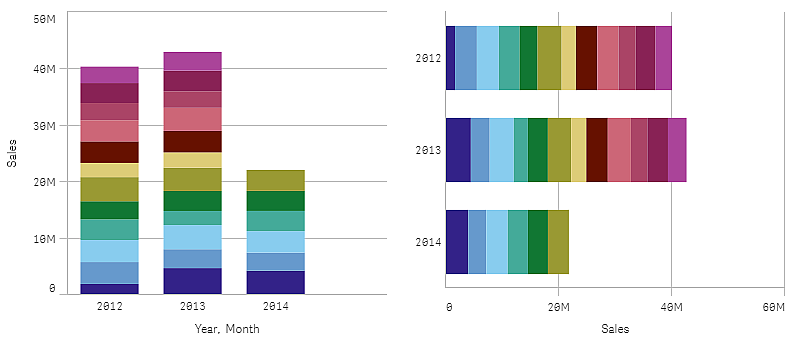
Stacked Bars: with stacked bars it is easier to compare the total quantity between different months.
The Bar Chart can be displayed horizontally or vertically, as in the example below:
Exploration menu for maps – allows users to toggle layers and labels, adjust object size and change the base map image, map language, legend and zoom configuration.
Qlik Sense Mobile™
Push notifications to Qlik Sense Mobile™
Qlik Sense Mobile™ for iOS and Android introduce support for native mobile push notifications. Administrators can push system notifications to their users from the Qlik Management Console™. Notifications can be sent to all users, or to specific subsets of users and can include a link into a dashboard.
System notifications can be useful to inform users about updates to dashboard, or to announce system events.
Multi Cloud
The following capabilities are now available for Qlik Sense Enterprise™ on Cloud Services (SaaS) and Qlik Sense Enterprise™ on Kubernetes deployments:
– insight advisor precedent based learning; – download a single Visualization as data to Excel; – support for RedHat Openshift in Qlik Sense Enterprise™ on Kubernetes. This feature is not available in Qlik Sense Enterprise™ on Cloud Services.
Qlik™ Connectors
– Single sign-on (SSO) support in Windows.
For Qlik™ information, please click here: qlik.com.
For QQinfo solutions, please visit this page: QQsolutions.
This website uses cookies to improve your experience. We'll assume you're ok with this, but you can opt-out if you wish.AcceptRejectRead More
Privacy & Cookies Policy
Privacy Overview
This website uses cookies to improve your experience while you navigate through the website. Out of these, the cookies that are categorized as necessary are stored on your browser as they are essential for the working of basic functionalities of the website. We also use third-party cookies that help us analyze and understand how you use this website. These cookies will be stored in your browser only with your consent. You also have the option to opt-out of these cookies. But opting out of some of these cookies may affect your browsing experience.
Necessary cookies are absolutely essential for the website to function properly. This category only includes cookies that ensures basic functionalities and security features of the website. These cookies do not store any personal information.
Any cookies that may not be particularly necessary for the website to function and is used specifically to collect user personal data via analytics, ads, other embedded contents are termed as non-necessary cookies. It is mandatory to procure user consent prior to running these cookies on your website.