Systematically producesP&L reports (and Balance Sheet and Cash Flow Indirect)
Adaptable to multiple reporting requirements
Configurable processes of reading and consistent processing
Multiple audit of reporting quality for maximum turst
The main ideas presented on this page are briefly listed below
QQfin™ Benefits
Coherent, fast, systematic and unitary processing, starting from the accounting notes (SQL / xls / csv) and budgets (xls / SQL / csv / etc.) to the final report.
Multiple reporting perspectives for different needs or different destinations available in the same place, one click away, or in direct comparison views.
Options for choosing the relevant budget version (including quick choice of the latest version).
Comparison between current versus budget, current budget versus previous budget, different budget versions, etc.
P&L + BS + CF reports (indirectly) in the same place, with the relevant selections interconnected, where needed (time / branch / time perspective / budget version / reference date / etc.).
Access right control (complete, but also specific on data subsets / on pages or views / on sensitive data columns).
Add extra-accounting adjustments, manual or from external sources: +their immediate identification in the interface (disclosures); +their immediate inclusion / exclusion in the analysis interface; +comparisons between results with and without adjustments.
Quick reconfigure data reading, instead of rewriting the script from scratch.
Quick and systematic reconfiguration of formulas using formula nomenclature (including dynamically constructed formulas).
Integration of data history from different ERPs.
Bidirectional integration with Planacy for efficient / consistent / controlled budget editing.
Stable system, reused in various industries (transport, production, betting, vending, distribution, printing, pharma, FMCG retail, etc.).
Basic Functionalities inQQfin™ interface
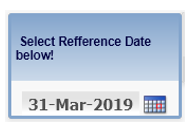
1. Choice of reference date (default today or yesterday), but the user can choose any previous date, but also the analysis perspective
2. Selection Currency of representation
3. Quick time selection (classical in Qlik™)
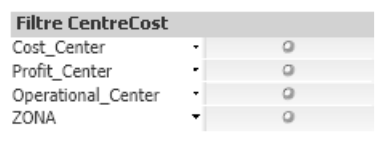
4. Selection of subunities / cost centers (classical in Qlik™)
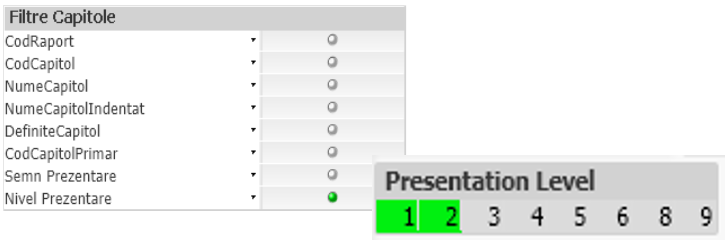
5. Report type selection, report, reporting chapters, but also reporting levels !
6. Selection of relevant columns in tabular view (conditional show)
7. Selection of relevant perspectives including accomplished versus budgeted, temporal granularity, or comparison lag
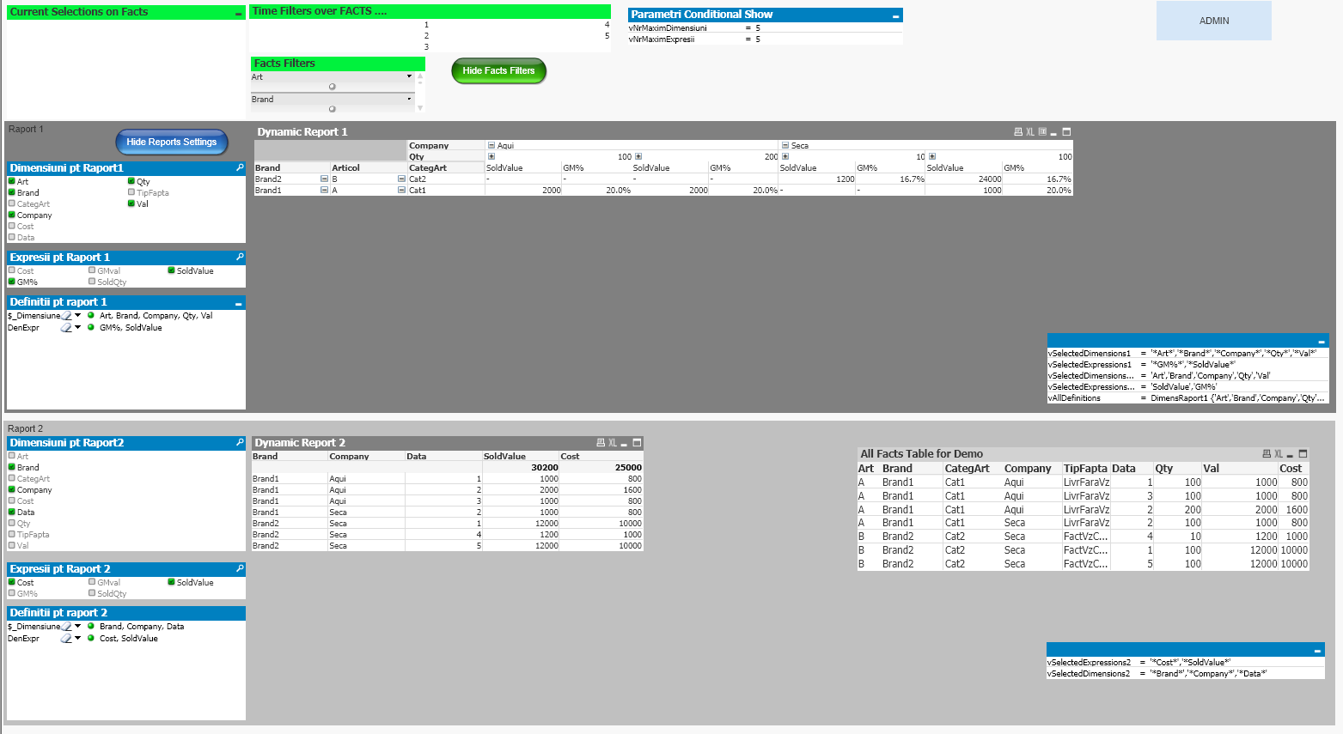
8. Report Builder (dynamic object in which the user can bring any column with size or size available for the interface and then select any subset of data)
Basic Functionalities in Scriptand DataArchitecture
SIRQ™Engine (Qlik™ Rapid Deployment System) Allows you to configure data reading, instead of rewriting the script from scratch.
QQpl™ Engine (ultra efficient) Allows the definition of reporting chapters
either associated with accounts and / or combinations of accounts with other dimensions of the accounting notes (or other quantitative records)
either to be calculated from the above (with operators +, -, /, etc.) (obs. importance about the division operator: eg for% GM,% EBITDA, etc., but also for Income / sqm or Income / person, etc.)
QQslicer™ Engine Allows distribution of an accounting record in finer slices according to multiple, compound and cascade distribution rules. The application is done systematically, repeatedly, without the need for individual interventions, using QQadjustments.continue and a Data & Process Quality Check engine that confirms full data processing, without multiplication or loss.
QQadjustments™Engine Allows alteraion (modification/ deletion) of accounting records or addition of completely new records, in order to adjust the final reports without altering the ERP data. However, this alteration remains traceable, identifiable, selectable and selectable in the interface, depending on the immediate need of the user.
Processes Monitoring Engine Allows saving of meta information about the reading processes (volume of data processed, processing time, processing results, including number of rows for further analysis, both in debugging mode and in admin supervising mode).
As Of Engine Allows efficient calculation of accumulated balances to date (for indirect BS & CF).
Temporal Formulas Engine Allows the construction of formulas with all time perspectives and quick set analysis for analyzes at the reference date.
By hiring QQfin, the whole project is strong and modularized, with a direct positive impact, both in the initial effort, duration and budget, and in the simplification of subsequent maintenance.
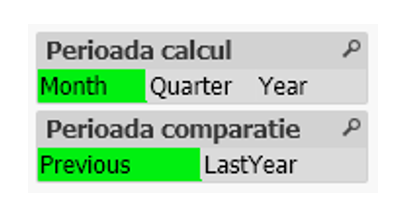
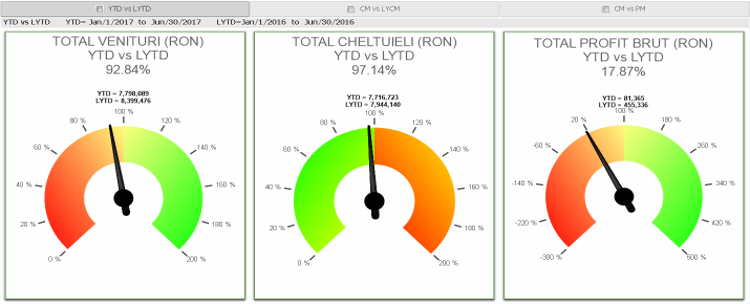
Visual Perspective in P&L - Dashboard
– Compared to previous periods
– Compare to the budget …
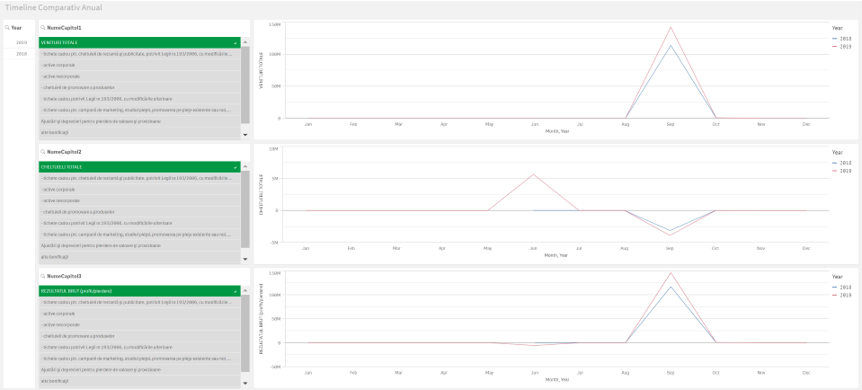
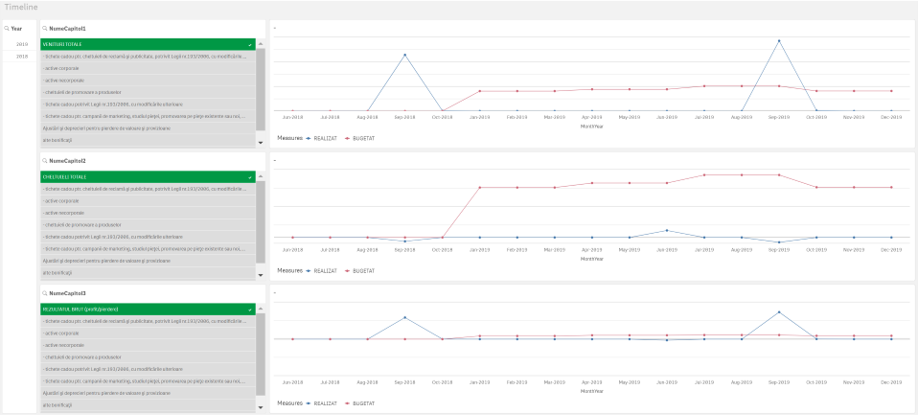
Visual Perspectives in P&L - Timeline (evolution over time)
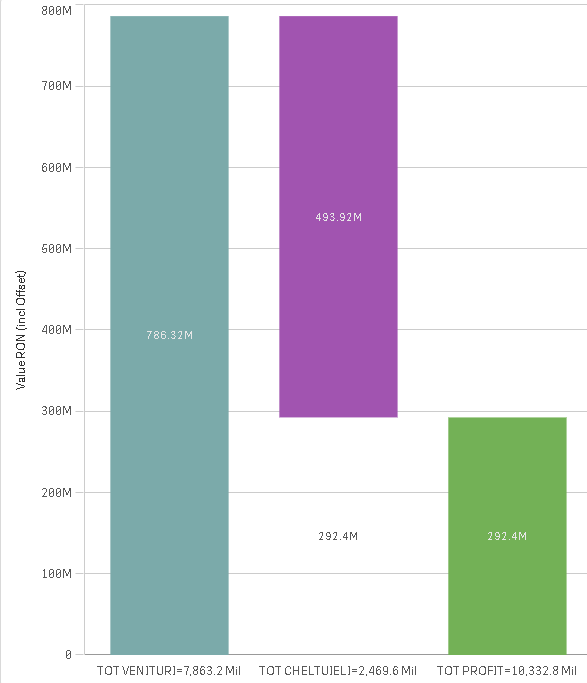
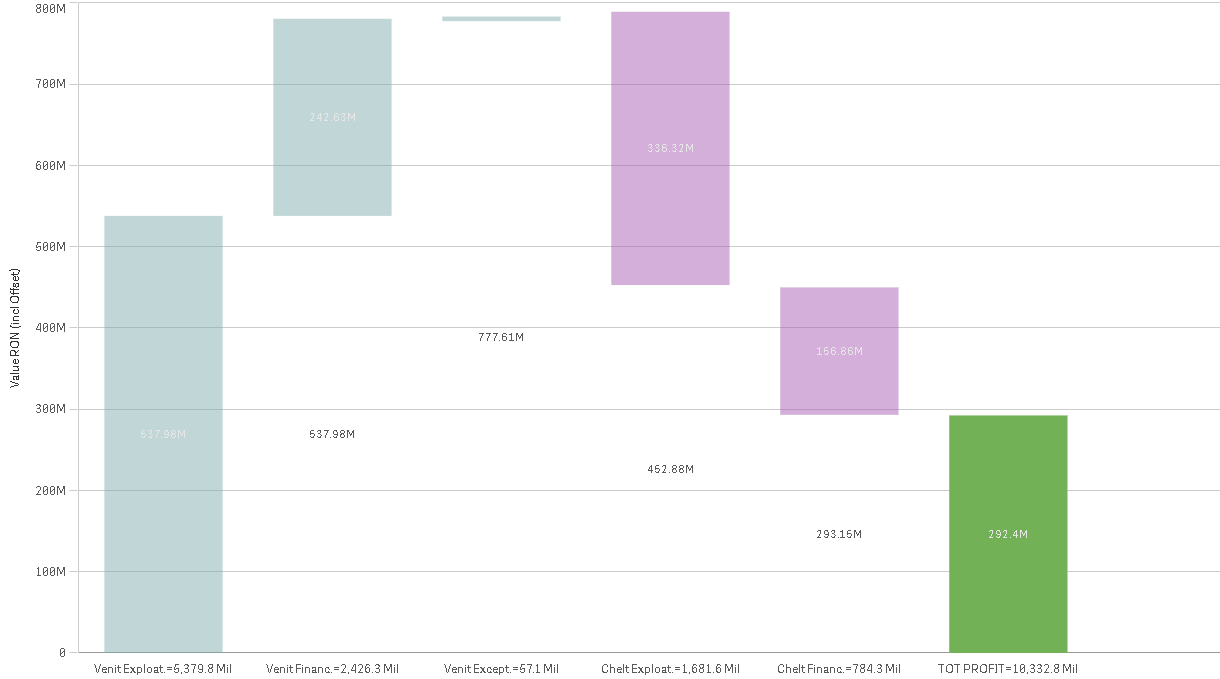
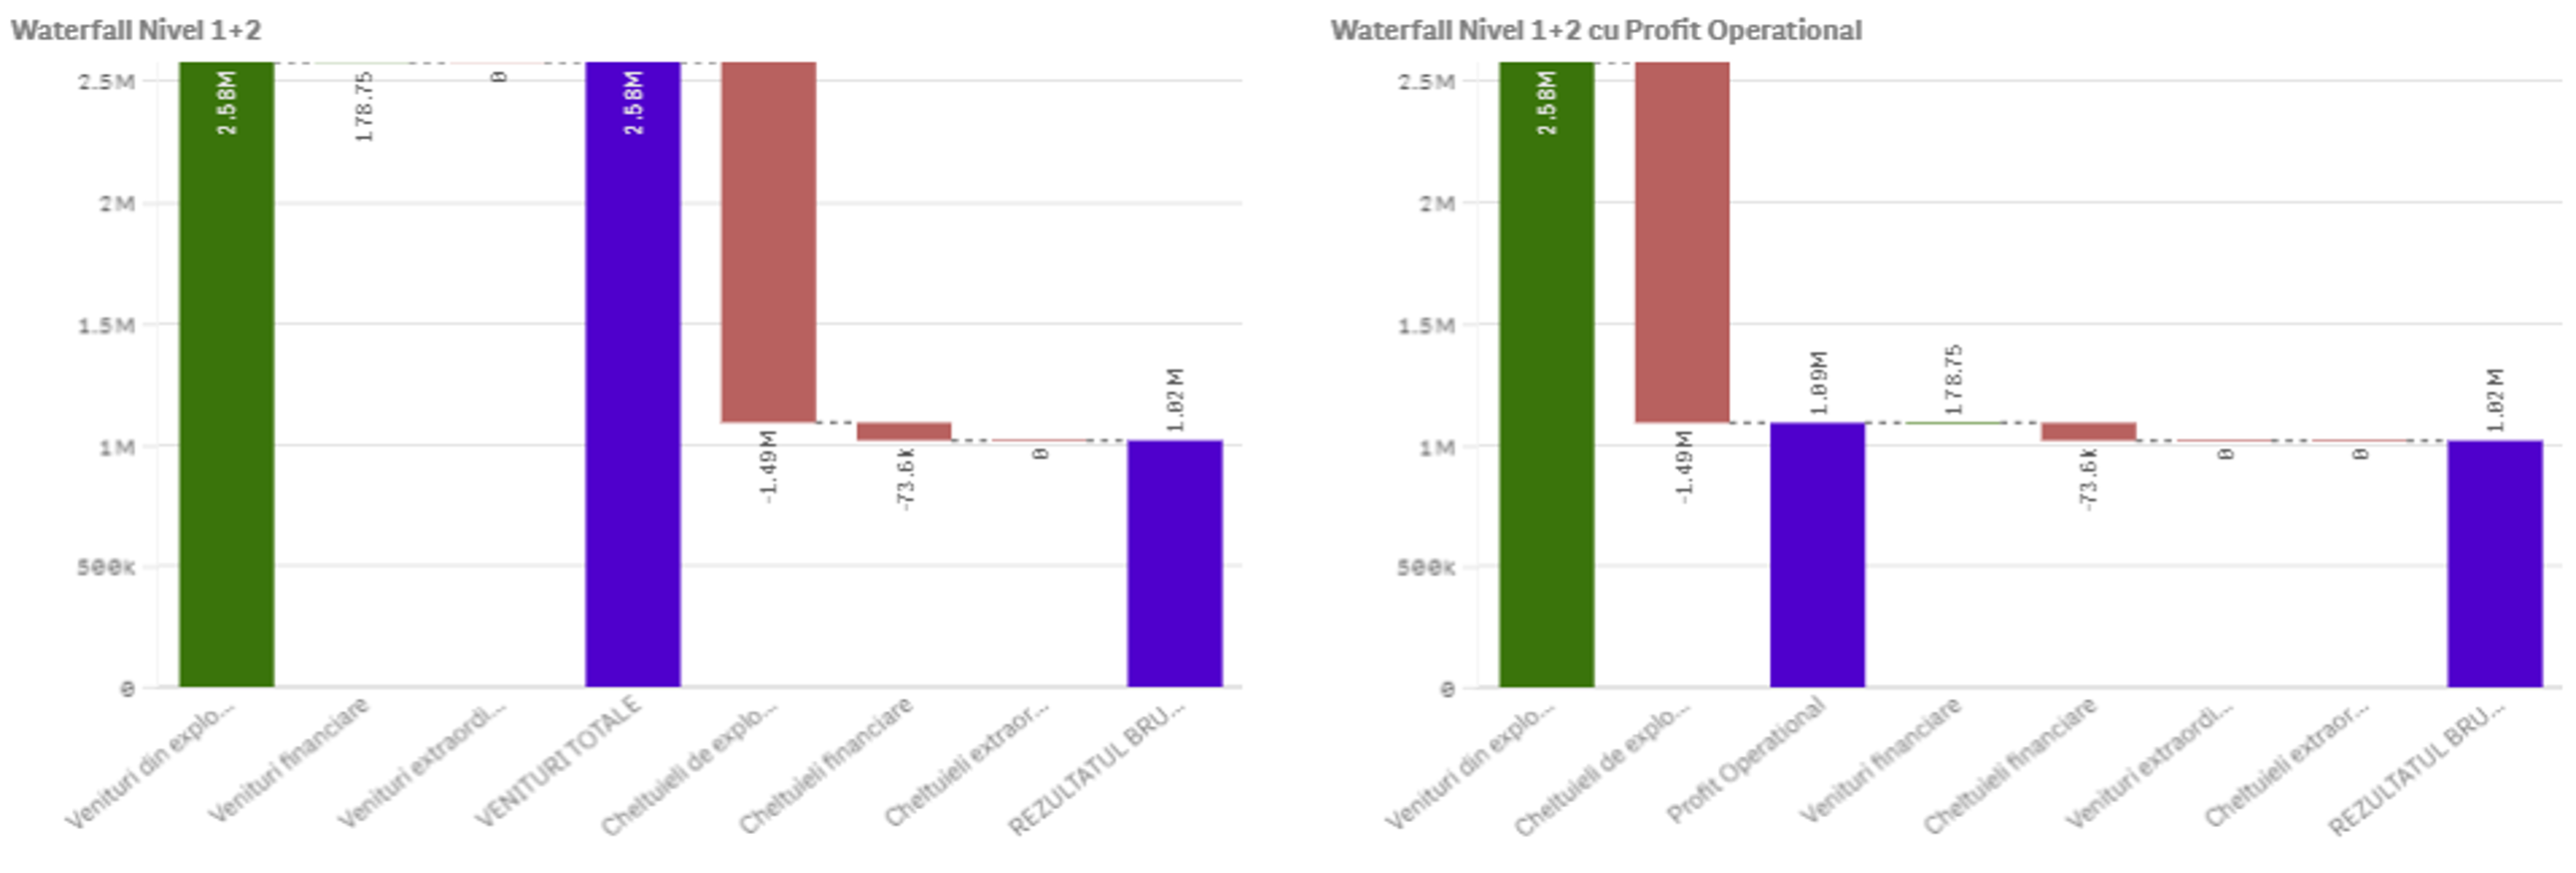
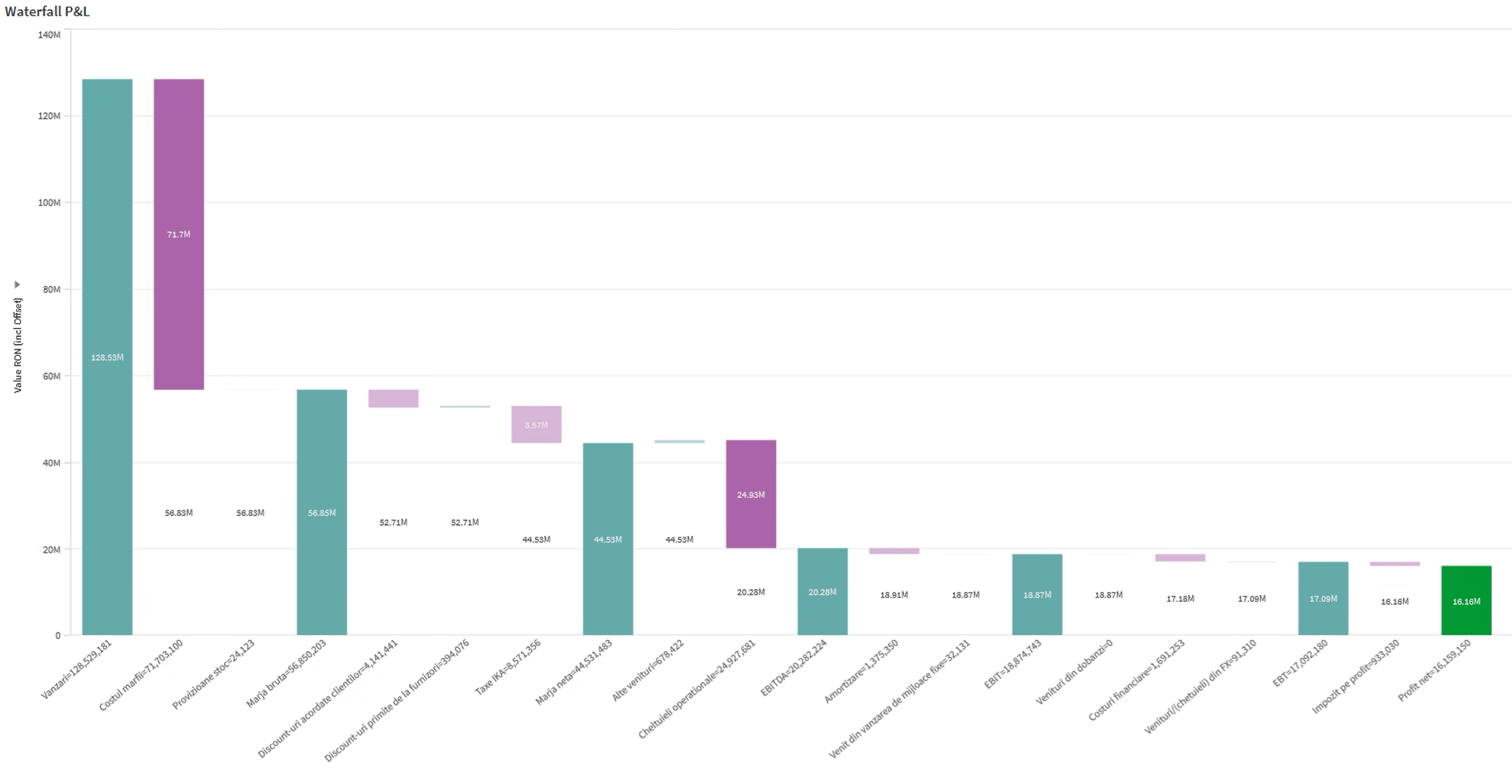
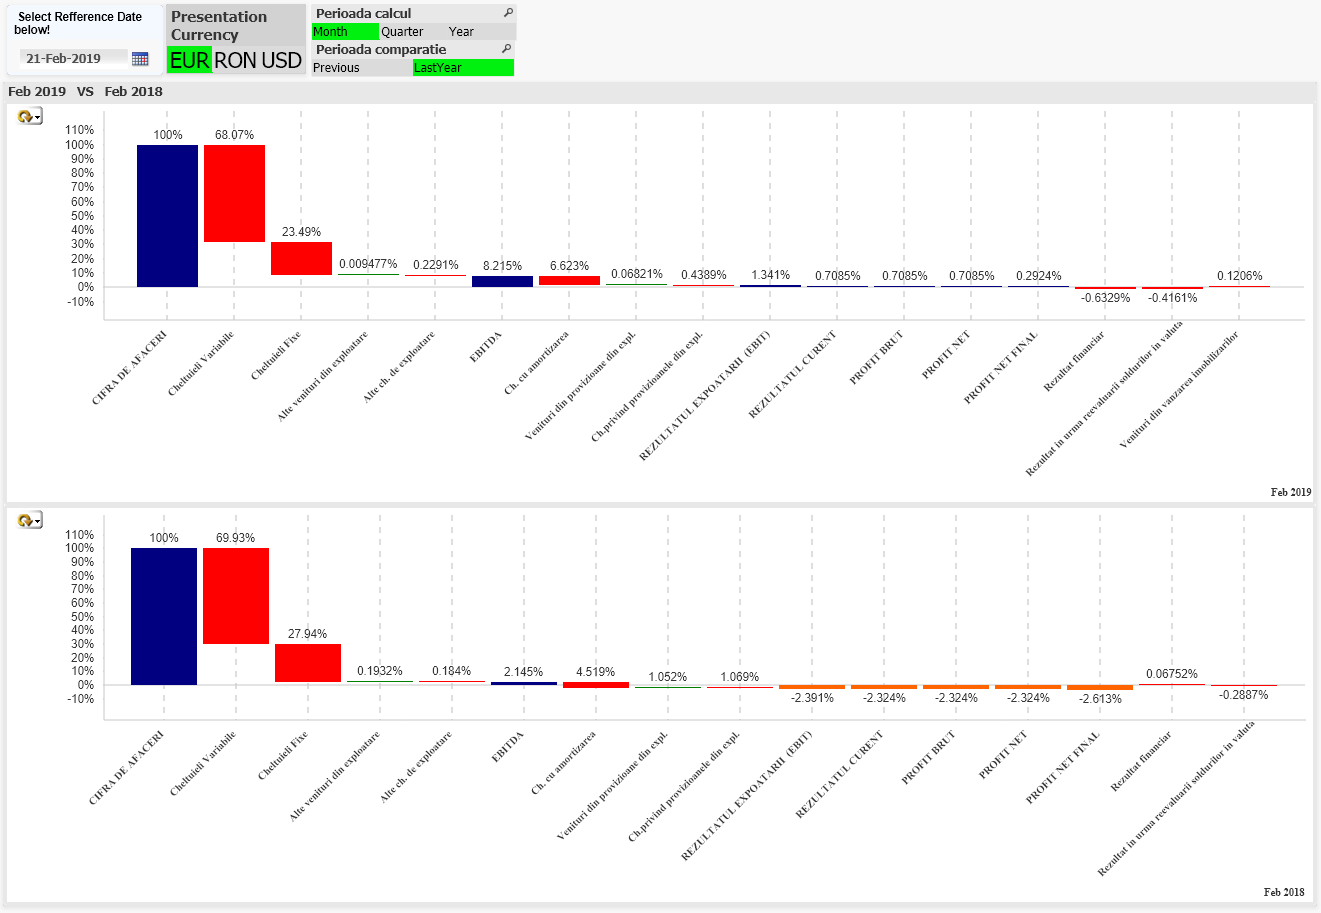
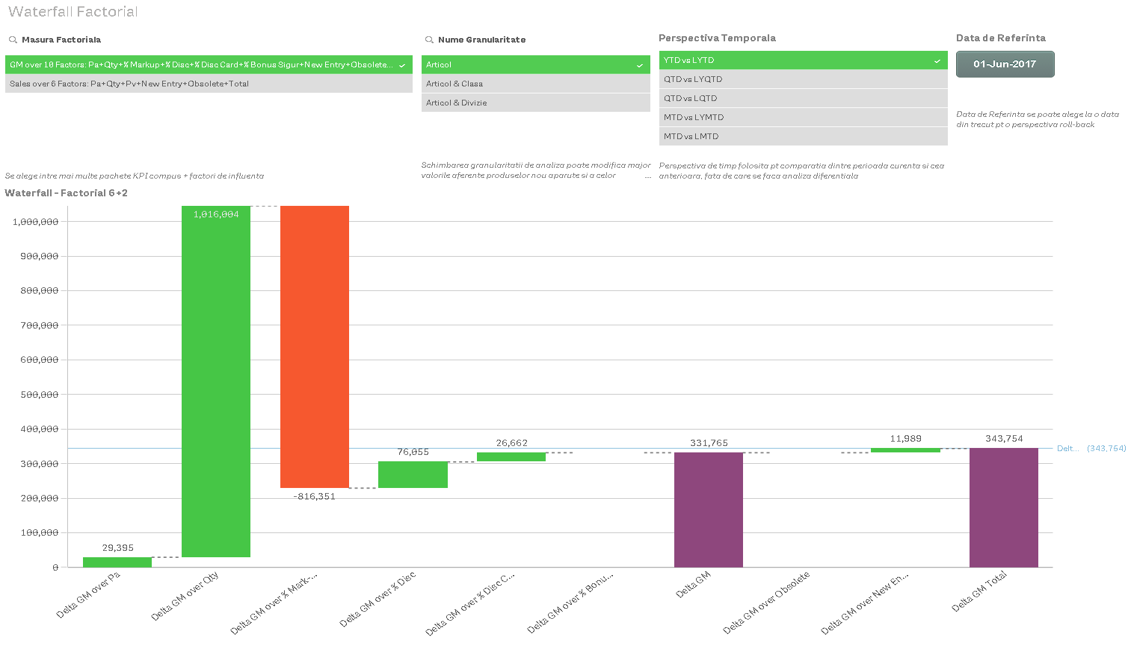
Visual Perspectives in P&L - Waterfall
Waterfall views are extremely powerful in profitability analysis, immediately giving a visual understanding of the impact of certain chapters on final profit.
QQwaterfall ™ allows, in the context of QQfin™, the construction of easily reconfigurable and selectable analytics, which highlight separately revenues and expenses, but also intermediate results (totals) or profitability assessment at intermediate levels of calculation (Commercial Margin, Direct Profit, Operational Profit [EBITDA]), Financial Profit, Gross Profit (EBT), Net Profit after taxes, etc.).
Configuration and reconfiguration allow you to quickly redefine the association between P&L chapters and Waterfall bars (many to one), define coloring rules, at the bar level or bar type, including signaling the entry into negative values of profitability indicators.
1. Low-medium complexity versions, different perspectives, dynamically selectable in the interface
Restricted visibility to Level 1 (total income & expend.) + Level 0 (profit)
Restricted visibility to Level 2 (slightly detailed income & expenditure) + Level 0 (profit)
2. High complexity version
Extended visibility to: Level 2 (slightly detailed income & expenditure) + Level 1 (total revenue and total expenditure) + Level 0 (profit)
Other Waterfall Visualizations
QQfin Flexible Waterfall
Visual Perspective in P&L - Waterfall (comparative)
In the more advanced projects, we also included the option to simultaneously view 2 waterfalls, aligned, to show comparatively the structure of profitability between 2 periods of time / business units or between achieved and budgeted.
A third object, also aligned, highlights the percentage change and the impact on profit.
Compared with previous periods
… but also compared to the budget …
Flexible Comparative Waterfall
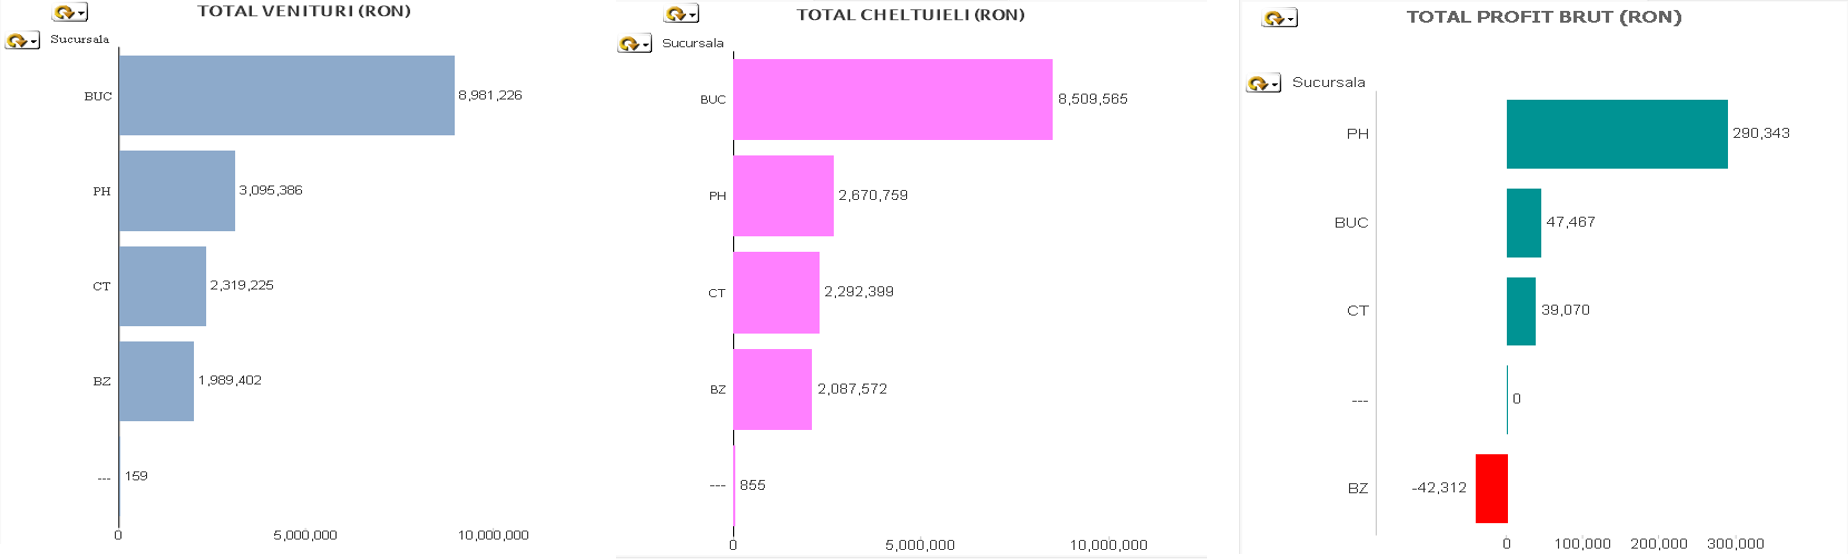
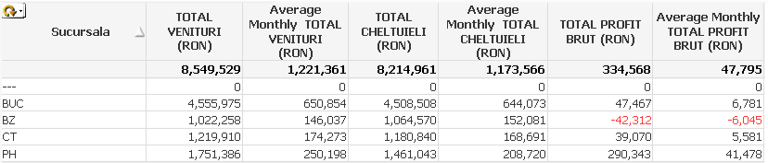
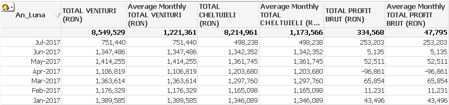
Visual Perspectives in P&L - Tops
Visual Perspectives in P&L - Rotation
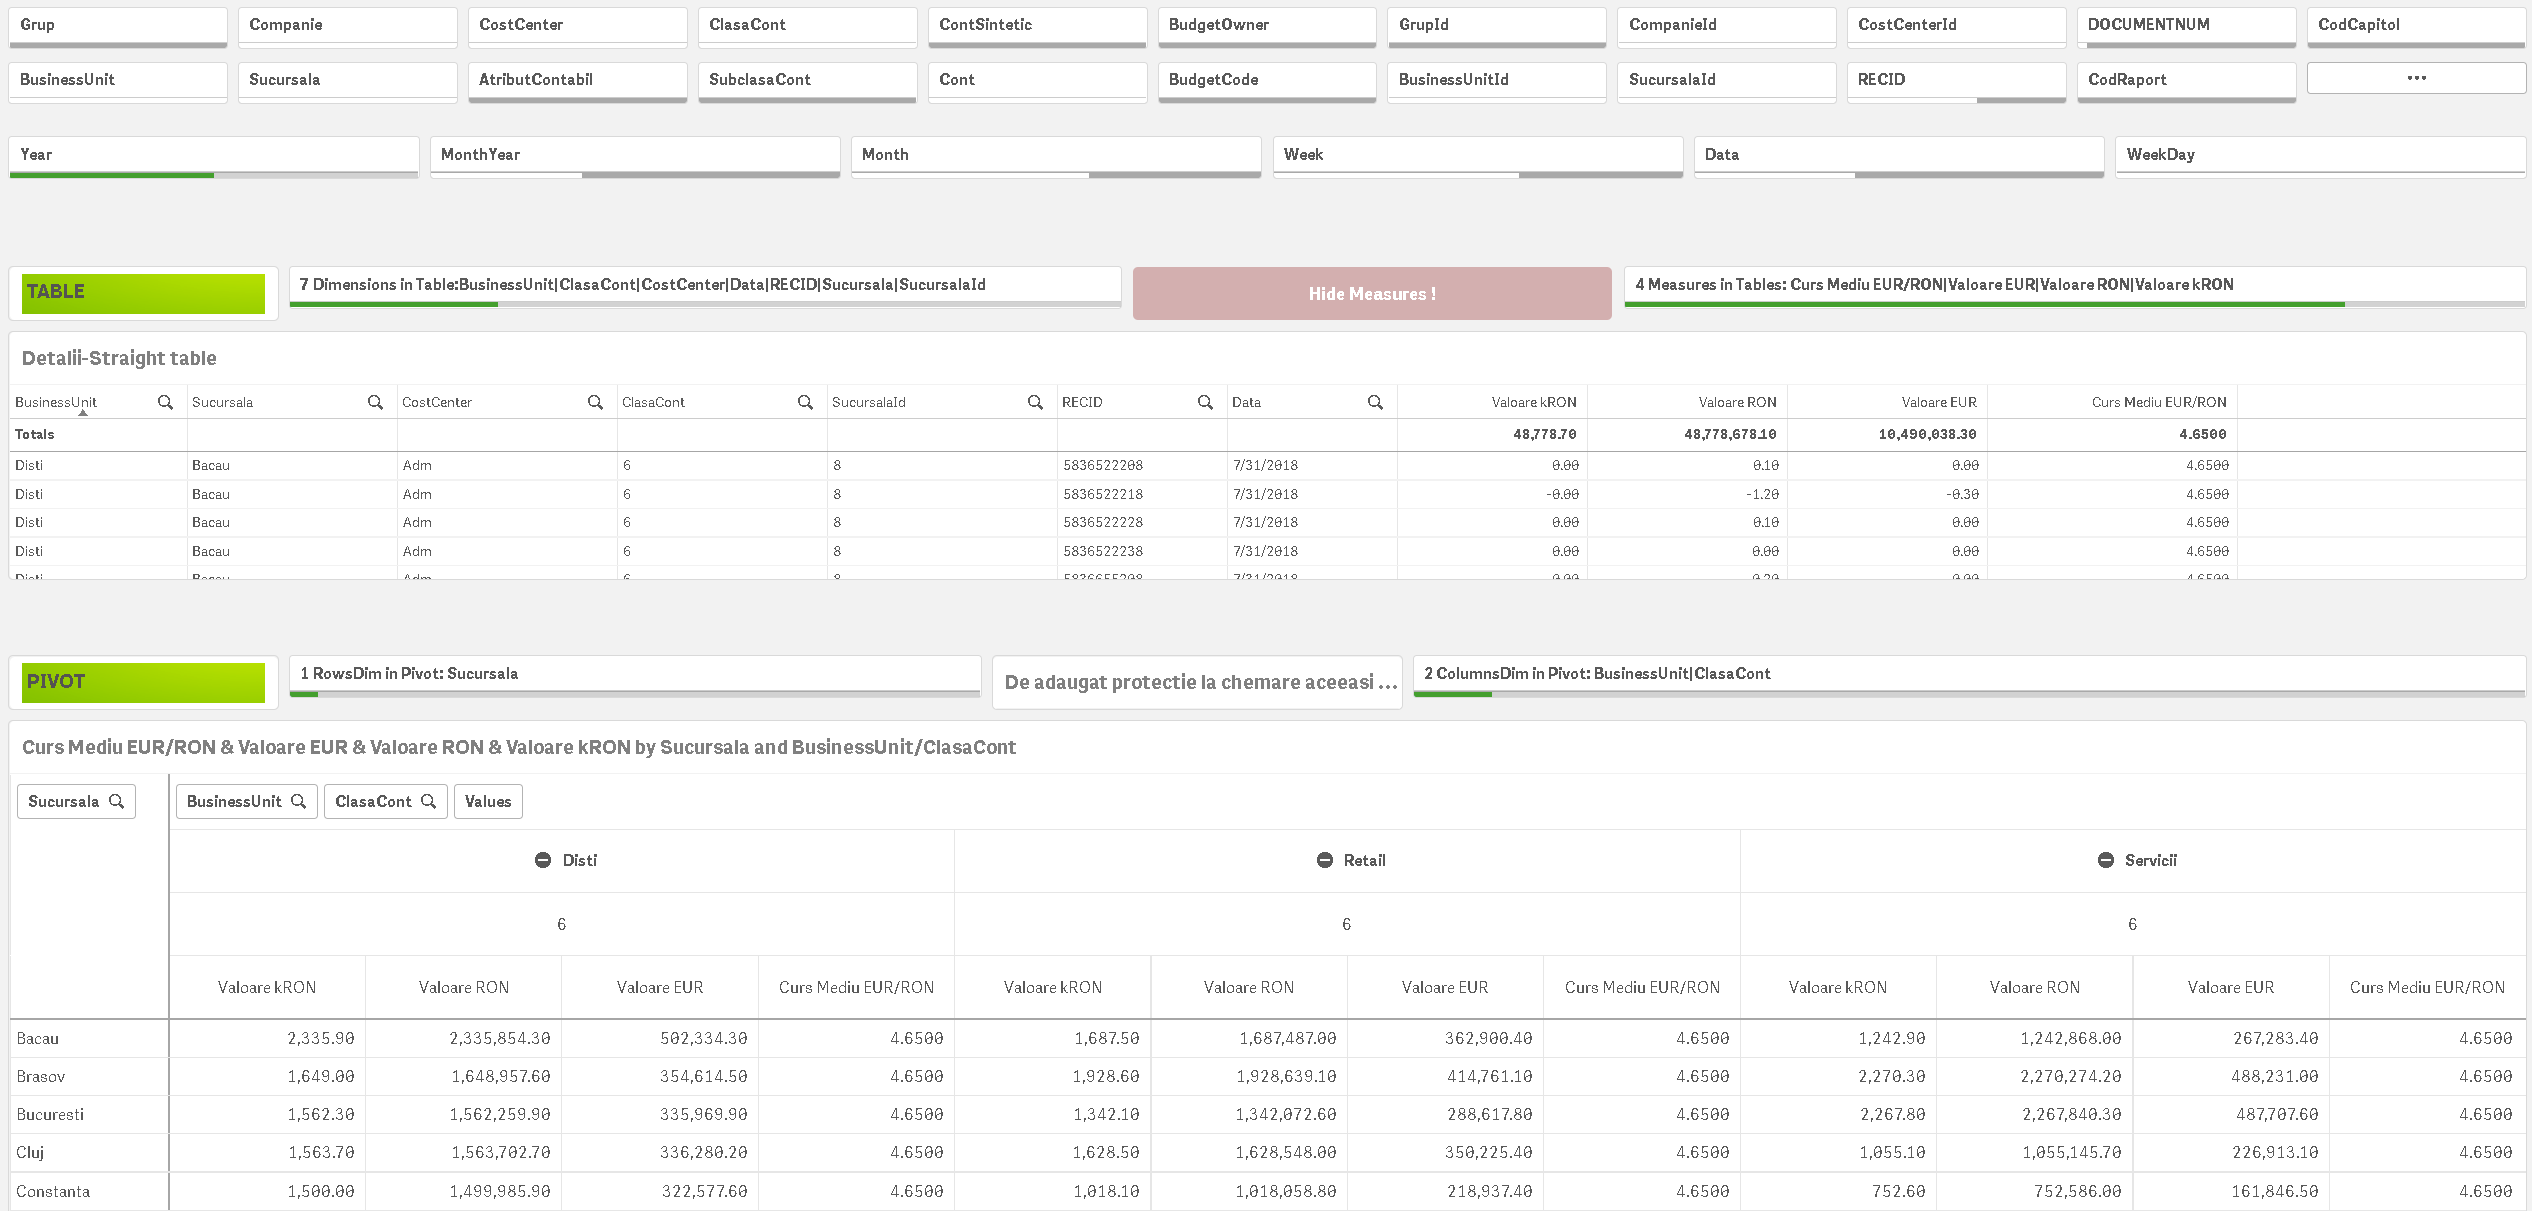
Visual Perspective in P&L - Report Builder
Such a visualization concept offers users a huge number of options for combining relevant data columns (for example, for a maximum of 24 available columns, no less than 70 thousands of billions of billions of different variants of viewing can be obtained [see more details here], without taking into account the multiplication due to possible leaks.
Defining the exact contents of the table is immediately available to the user:
Choose the desired dimensions from the offered palette At the pivot, 2 sets are available, for the dimensions on the left (in rows and the top ones (on columns)
Choose the desired measures from the offered palette
Apply relevant filters to data
The table with the chosen columns is obtained automatically (simple table & pivot table variant)
The user can also use bookmarks to later find the relevant combinations already chosen, including sharing them with colleagues.
The variant declined in Qlik Sense™
The variant declined in QlikView™
Optional:
the object can be reached only after performing the previous steps
or the object is activated only when the required data set is acceptably small
Visual Perspectives in P&L - Formatting & Coloring Control
You can define colors and thickening, specific to a reporting level in a report (both predefined and in the interface)
Basic coloring settings can be defined and activated (both predefined and in the interface)
You can define a character string to indent the reporting chapters (both predefined and in the interface, post reload)
You can define which chapters from which reports are relevant in the dashboard (both predefined and in the interface)
It's all about trust !
Data & Process Quality Checks
The delivery of quality managerial analysis is of paramount importance, but it depends on plenty of factors.
With the new analytical tools, which automate much of the data processing and assembly processes, the range of tools with which the quality and integrity of reports can be verified has been significantly diversified:
More details on all solutions to increase confidence in the information provided by the reports can be found here: QQtrust™.
Additional Possibilities
Optional Additions
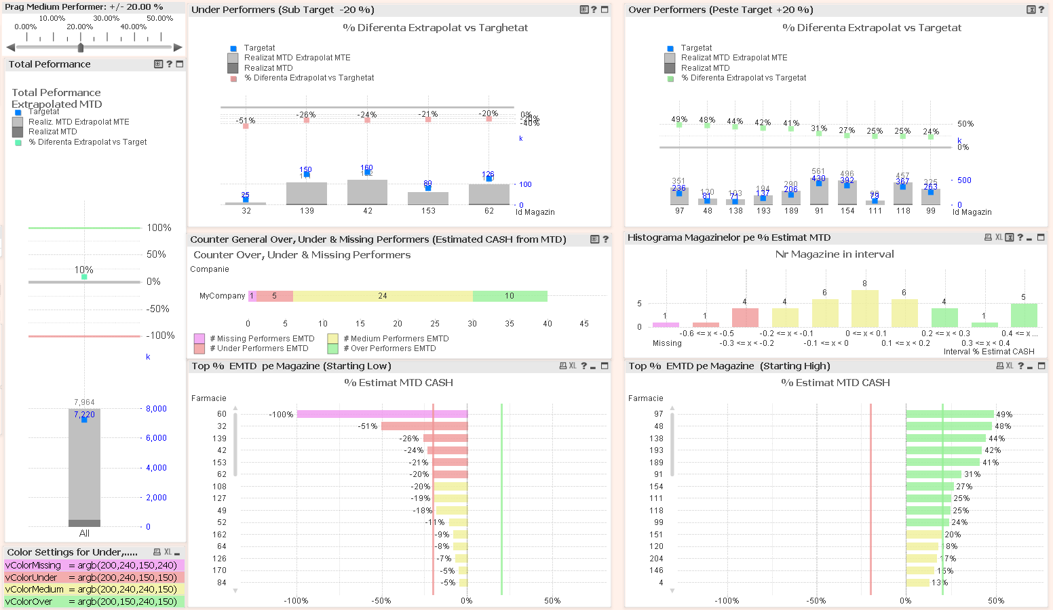
When the number of monitoring entities exceeds a few dozen, it becomes essential to apply the principles of exceptional management.
Here is an example of a performance monitor (and coders) monitoring screen that contains:
exclusive view of exceptions;
histogram view of many entities;
dual tops (for quick highlighting of extremes.
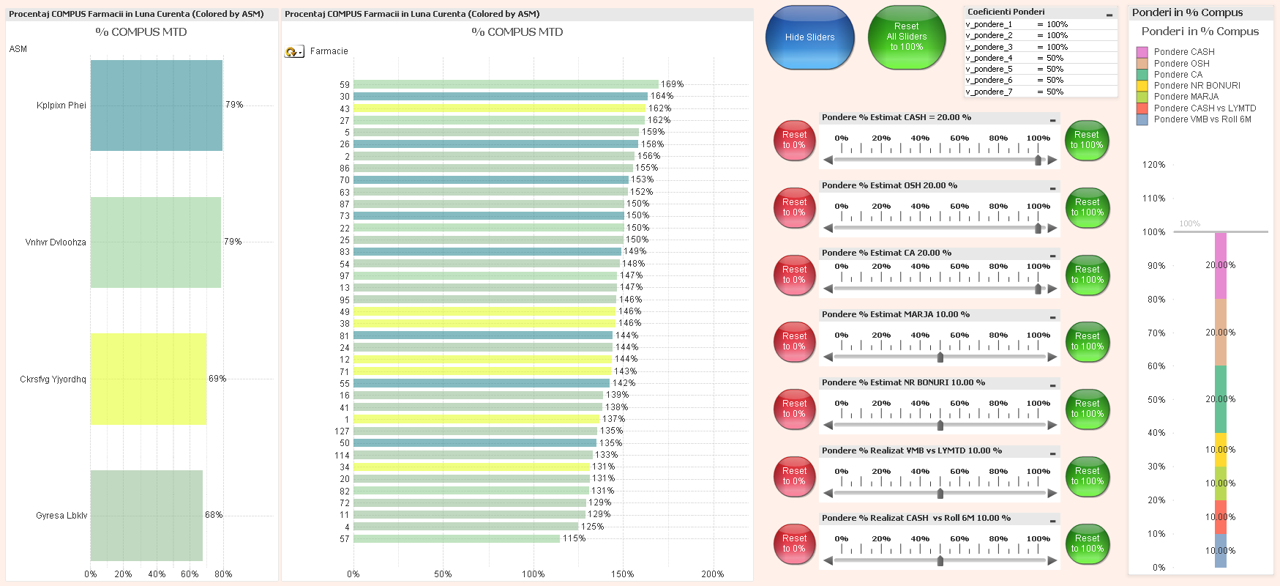
Vewing charts with consolidated grades on weighted criteria (including ASM)
Demo Factorial Analysis withQlik™
What factors have contributed to the variation of the margin from one period to another?
And what was the contribution of each factor?
Planacy
Planacy is a web-based budgeting and planning management tool, that you can use to define and manage complex budgeting processes, which involve several actos, with general, partial and mixed roles, interconnected even in cascading processes. Rescue, evaluation, approval and return processes are definable, drivers that push and process data between phases of budgeting operations. The system assists users in the rapid transfer of data subsets and in the distribtion of new values accoding to multiple rules, starting from proportionalities with previously budgeted or realized values, locks on subchapters or under totals, uniform distributions, etc.
It can be bidirectionally integrated with QlikView™ and Qlik Sense™ or other BI toold (Tableau/ Power BI).
More detailed information about Planacy is availale here: Planacy
Replacing Excel or SQL Budgets with the Planacy Platform
When the actual budgeting process is no longer executed exclusively in the finance department by 1-2 people,
but involves gathering detailed input from multiple department managers,
or when budgeting is a process that covers a group of companies.
The option to build bdgets in Excel becomes a managerial nightmare and an epic that spreads over 1 or even more calendar months.
The resumption of the process at half-yearly, quarterly or even monthly frequency for revised budgeting versions (or rolling estimates, or last estimates), further amplifies the pressure on the financial team to implement an efficient, fast & reliable budgeting process.
The alternative to the laborious approach based on Excel files (fragile and risky), is a collaborative planning-budgeting solution: Planacy, which will provide a deployment with a quick configuration, plus control and increased flexibility over the entire budgeting process.
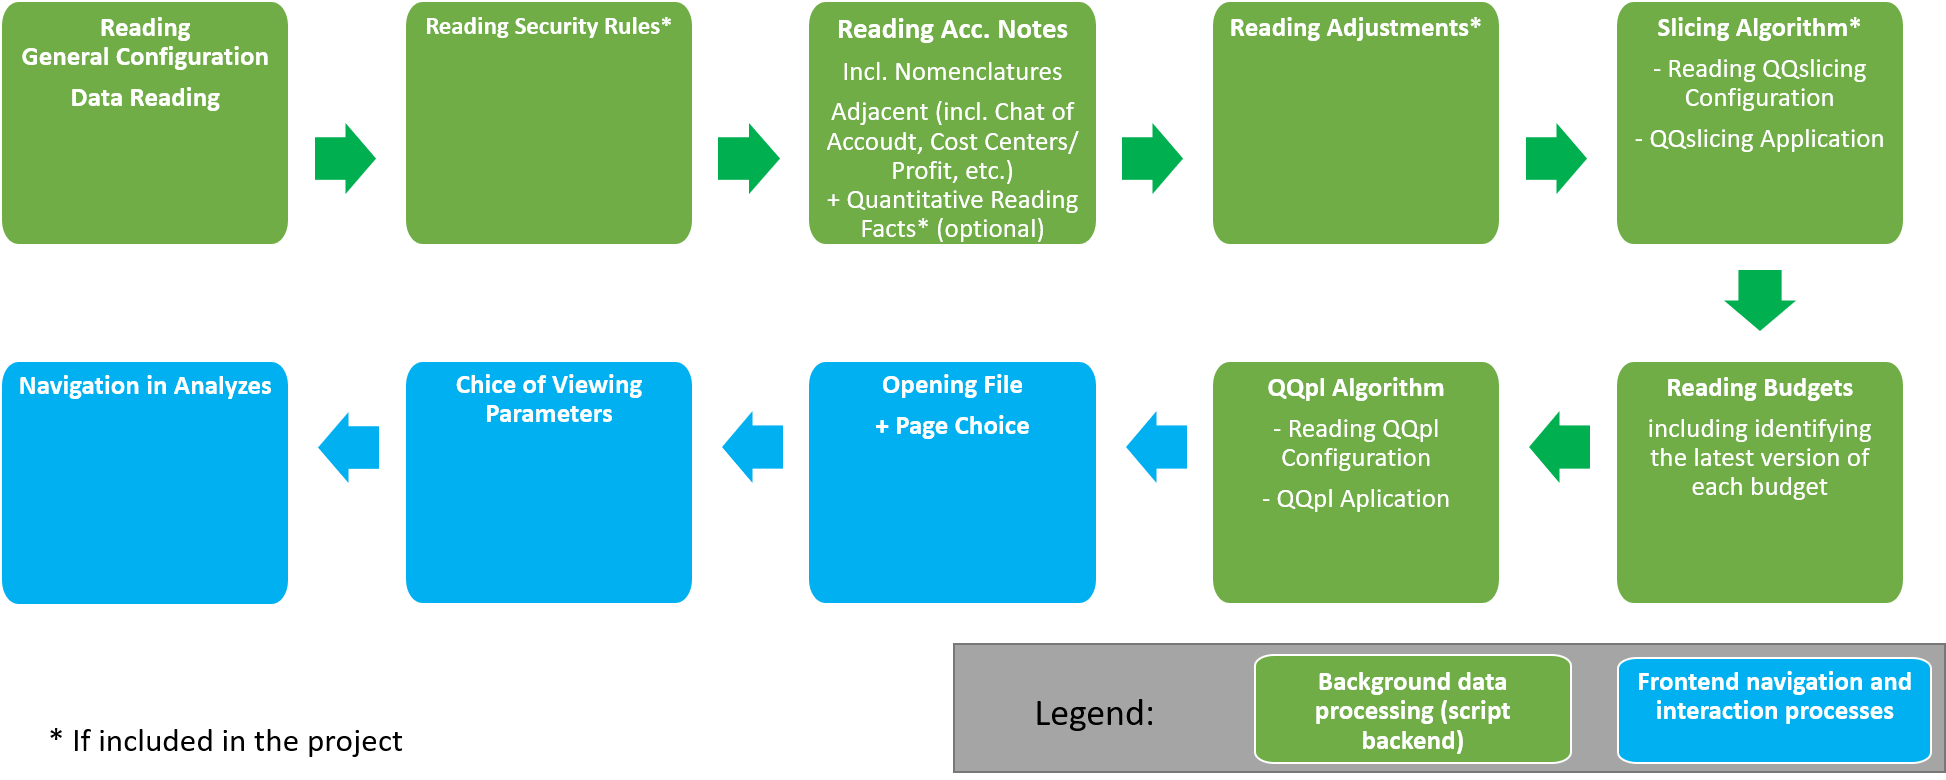
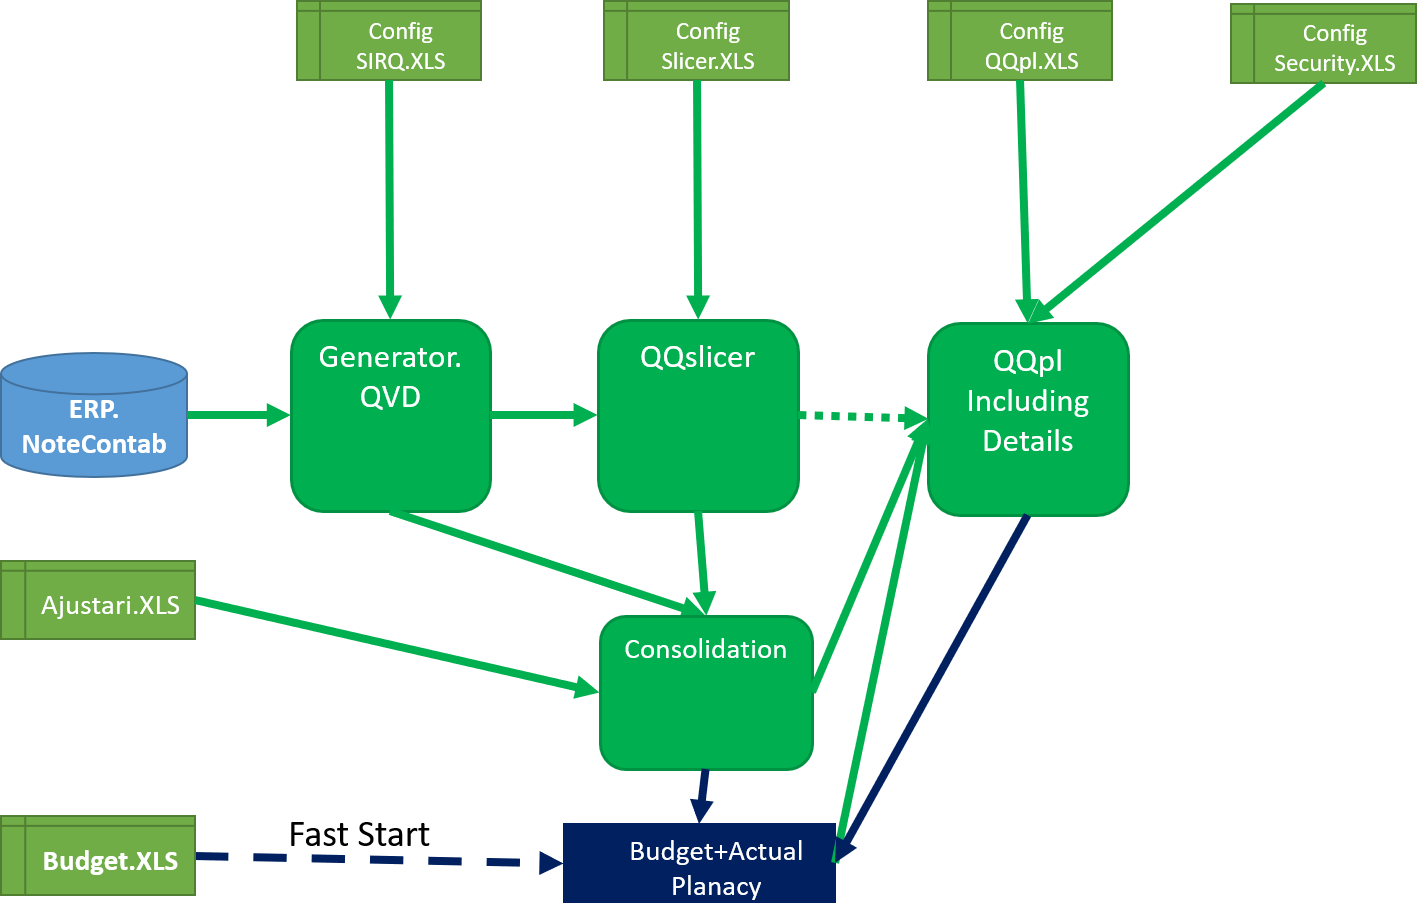
QQfin™ Processes Charts
Chart of Data Reading and Data Processing Processes
Below is the logic of processes that constitutes the QQfin™ solution.
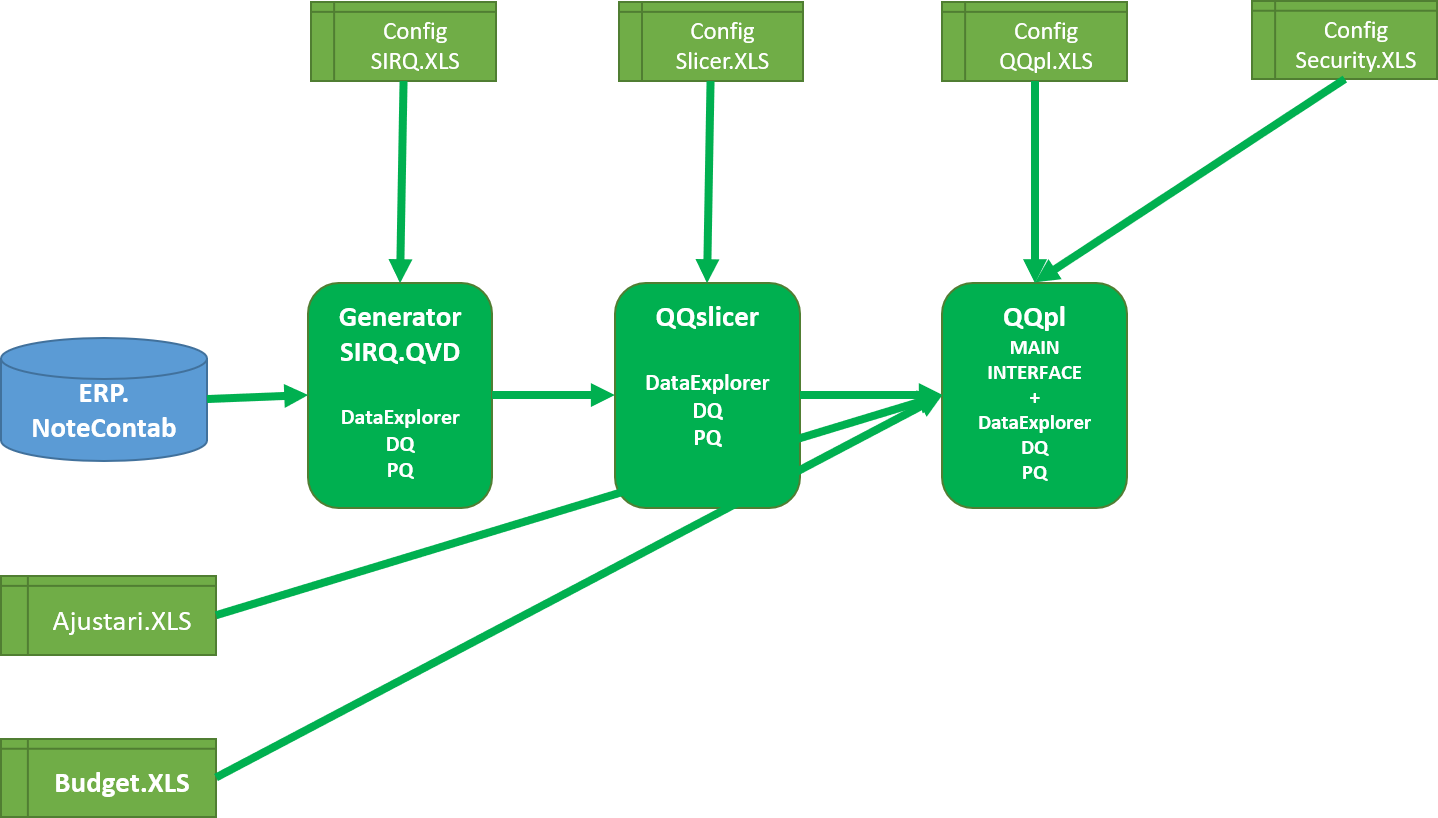
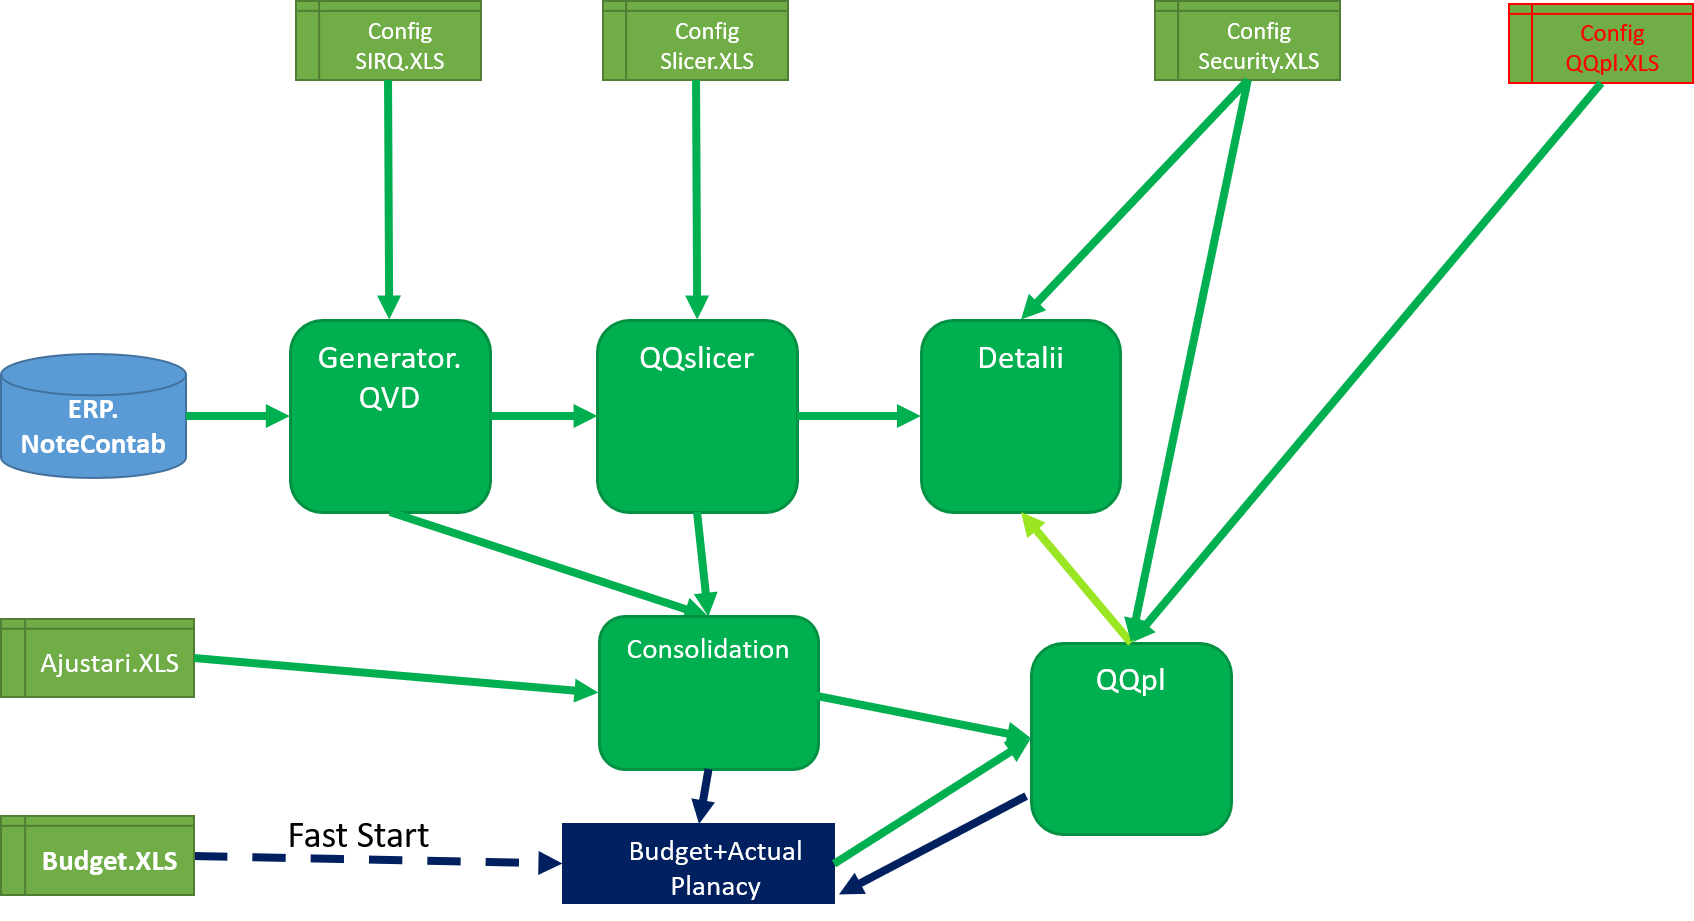
Below is visualized the structure of the essential elements that constitutes the QQfin™ solution.
QQpl™ + QQslicer™Integration Chart, running on QlikView™/ Qlik Sense™
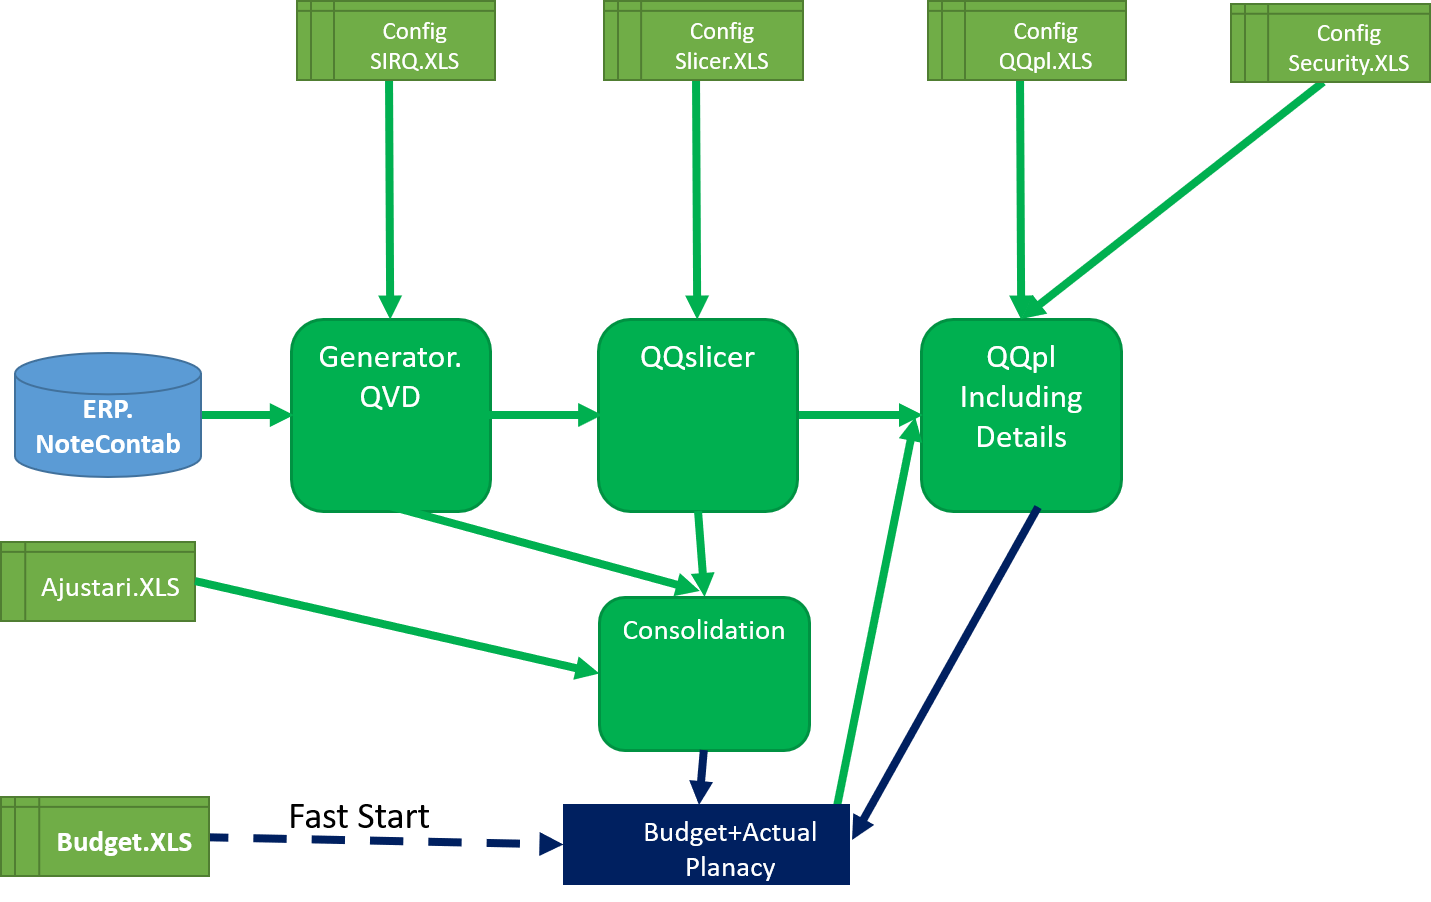
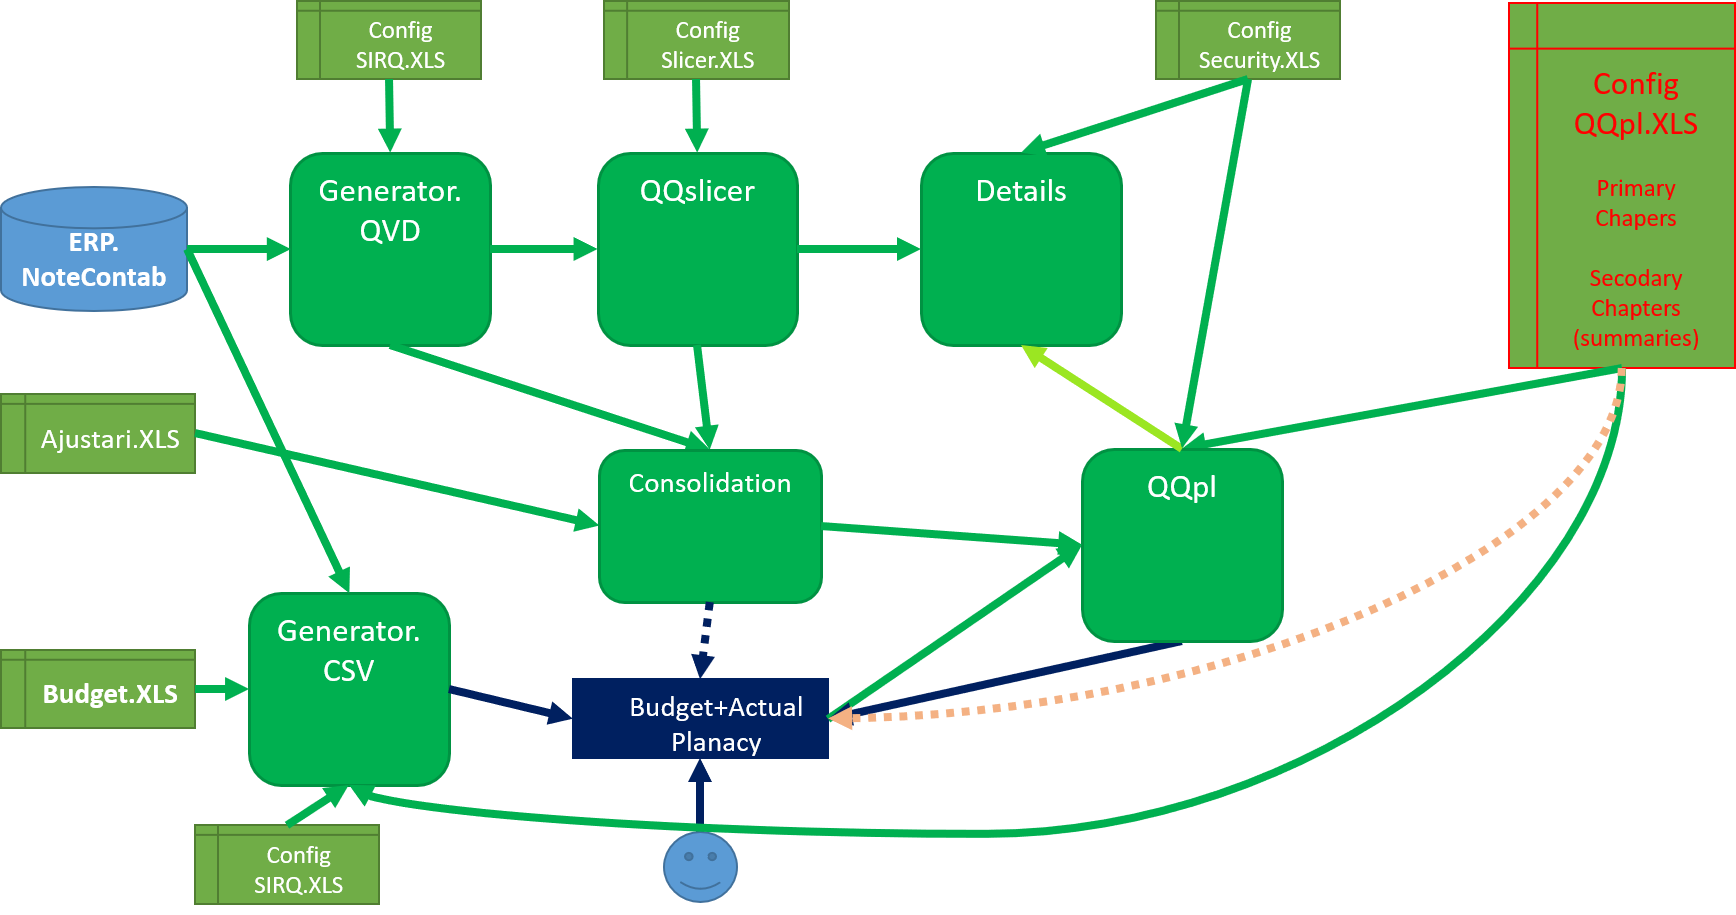
QQpl™+QQslicer™+ Planacy Integration – Variants
If you want to integrate the Planacy solution for better budgeting in QQfin™, this integration can be done in several variants, shown schematically below.
In this version, the Excel budgeting files are imported into Planacy, from which the entire budgeting logic is built in Planacy. The budgeting data defined in Planacy then becomes the data source for the Qlik™QQpl™ application, instead of the budget Excel files.
In addition, there may be links back to the Qlik™ interface in the Planacy budget editing area.
This alternative variant removes the details at the accounting note level from QQfin™ application, for an easier and faster data structure. It is especially relevant when the volume of details in the accounting notes is very large.
The disadvantage of this approach is related to the loss of transaction-level details in Qlik™ application, which significantly reduces the traceability of calculations and audit options.
To remove the limitations of the previous solution, in this case there are two Qlik™ applications, one that provides all the details of the transactions from the current accounting notes, and QQpl™ remains only with the comparative analytics accomplished versus budgeted. When details are needed, based on the Document Chaining mechanism in Qlik™, the Details application opens in the desired context (the set of slections from the main application is inherited when the application is opened with details).
QQpl™+QQslicer™+ Planacy – Integration Phase 2
To reduce redundancy in QQpl™and Planacy configurations, this approach interates the logic of defining the financial reporting chapters in the two platforms.
You don’t manage, if you don’t measure !
Manager time is the most over-requested resource, while management by Data & Facts becomes mandatory.
Market changes are more and more sudden and disruptive.
We need more and more agility.
BI & AI is the only way to survive !
The adoption of an integrated financial reporting system QQfin™brings simultaneously:
– increasing the speed of delivery of financial reports
– increased flexibility
– and reduce the risk of reporting errors
The adoption of the integrated planning-budgeting system Planacy brings:
– shortening the time for budgeting
– coherence and consistency in budgeting processes
– low total cost and high budgetary control
– increasing the frequency of budgeting without over-request
For information about Qlik™, click here: qlik.com.
If you are interested in QQfin™ product, please fill in the form here.
In order to be in touch with the latest news in the field, unique solutions explained, but also with our personal perspectives regarding the world of management, data and analytics, we recommend the QQblog !
This website uses cookies to improve your experience. We'll assume you're ok with this, but you can opt-out if you wish.AcceptRejectRead More
Privacy & Cookies Policy
Privacy Overview
This website uses cookies to improve your experience while you navigate through the website. Out of these, the cookies that are categorized as necessary are stored on your browser as they are essential for the working of basic functionalities of the website. We also use third-party cookies that help us analyze and understand how you use this website. These cookies will be stored in your browser only with your consent. You also have the option to opt-out of these cookies. But opting out of some of these cookies may affect your browsing experience.
Necessary cookies are absolutely essential for the website to function properly. This category only includes cookies that ensures basic functionalities and security features of the website. These cookies do not store any personal information.
Any cookies that may not be particularly necessary for the website to function and is used specifically to collect user personal data via analytics, ads, other embedded contents are termed as non-necessary cookies. It is mandatory to procure user consent prior to running these cookies on your website.