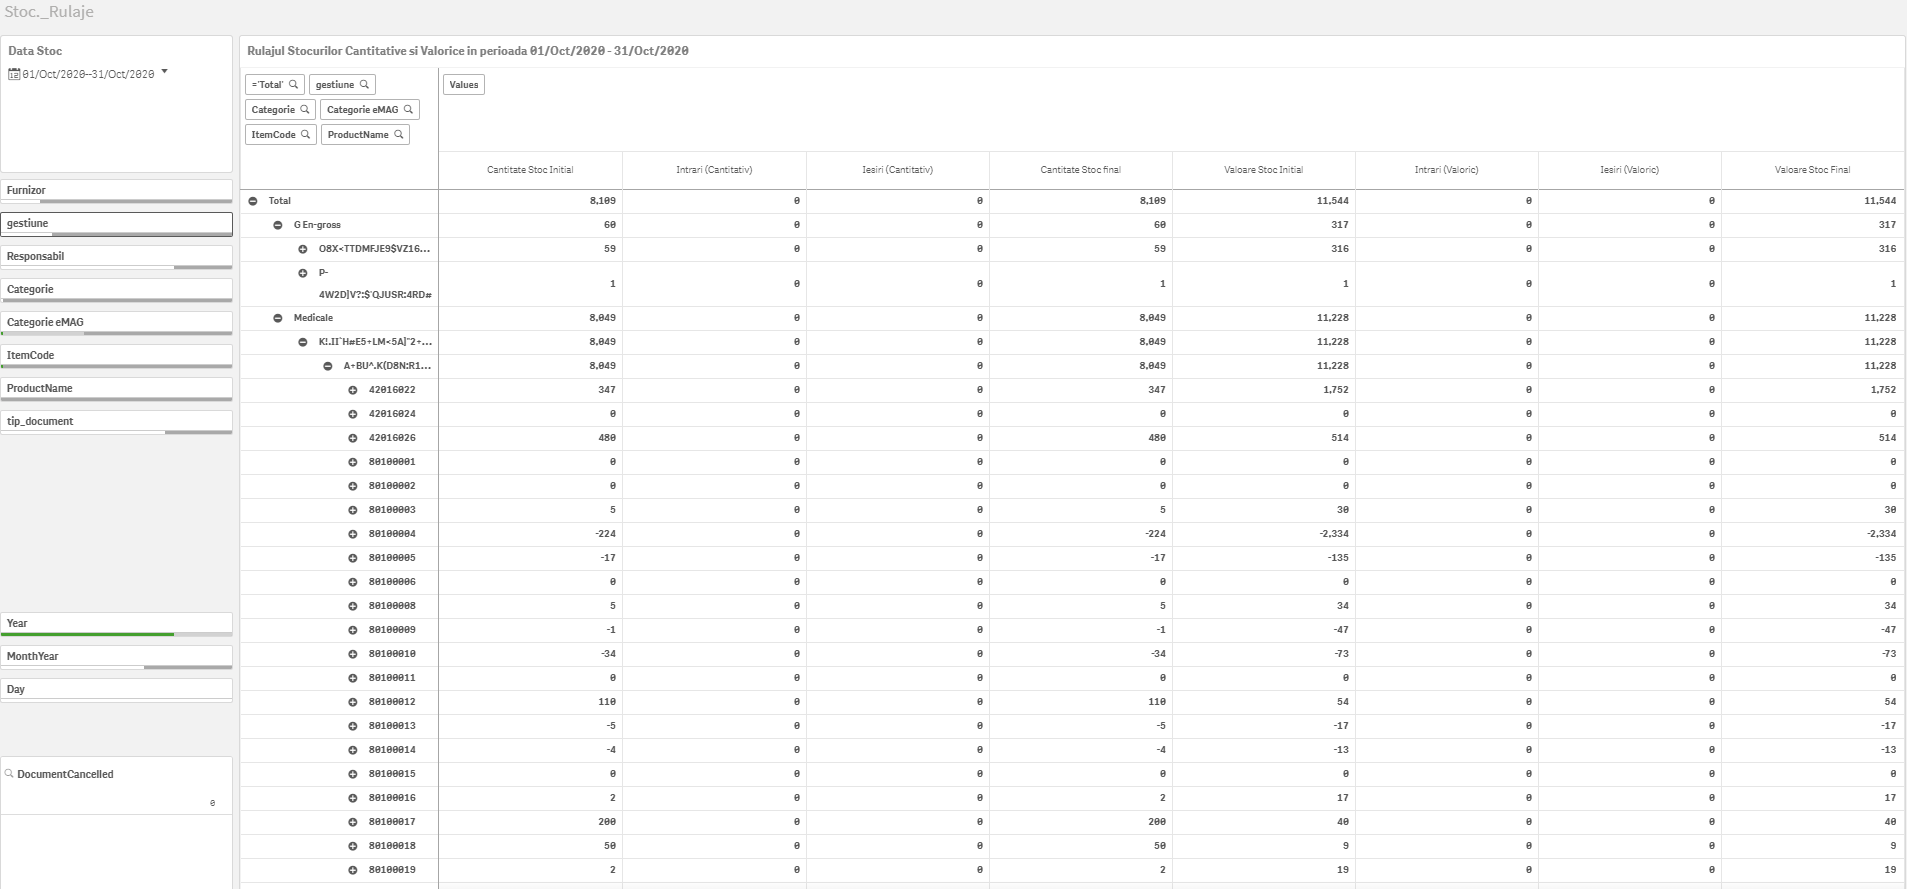
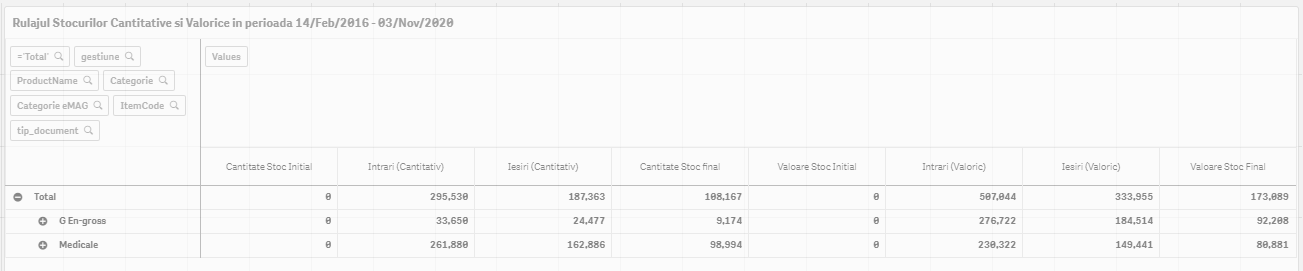
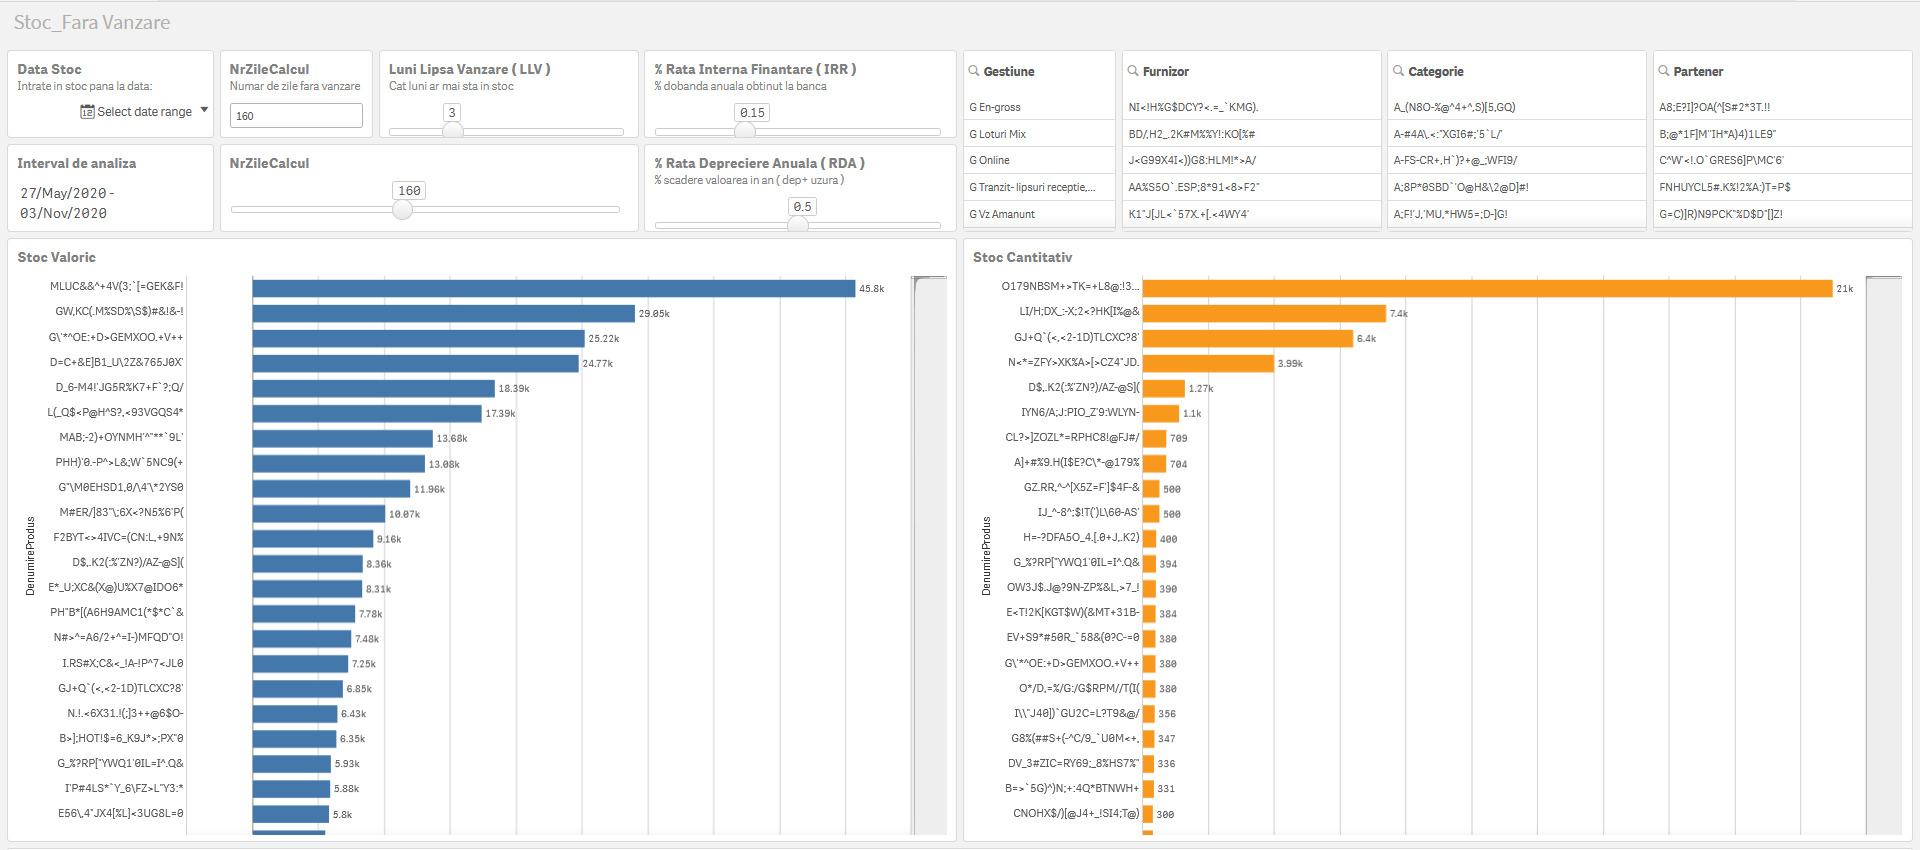
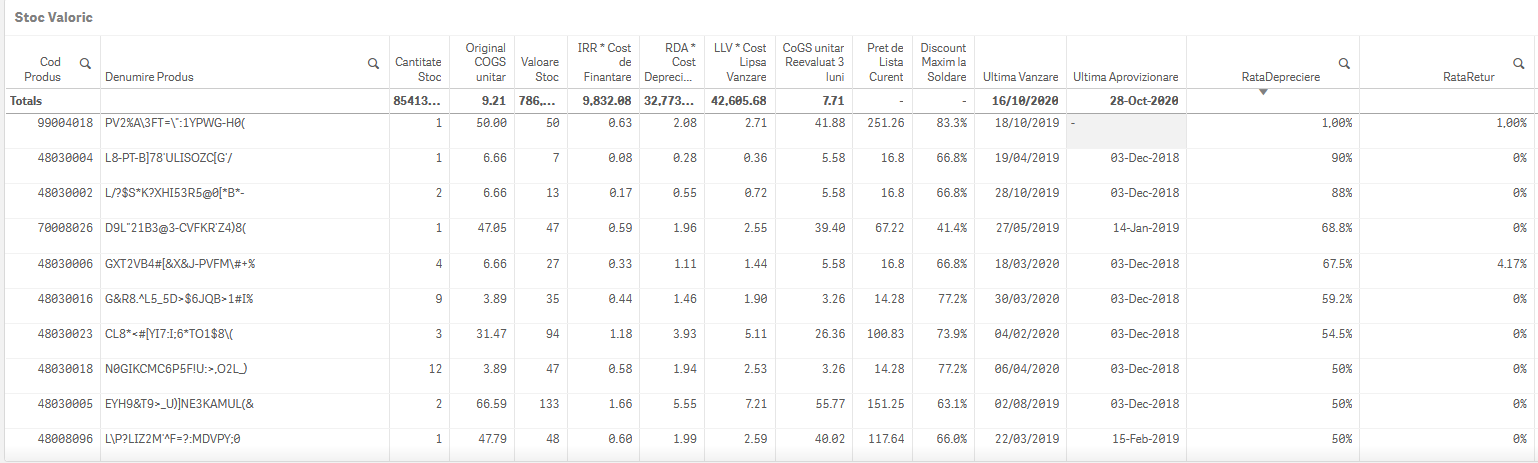
Inventory analysis is essential in identifying supply consistency issues.
In addition, especially in conditions of extreme volatility of supply and demand in these pandemic times, tools are needed to assist managers and entrepreneurs in quickly identifying high-risk stock situations.
The main ideas of the page
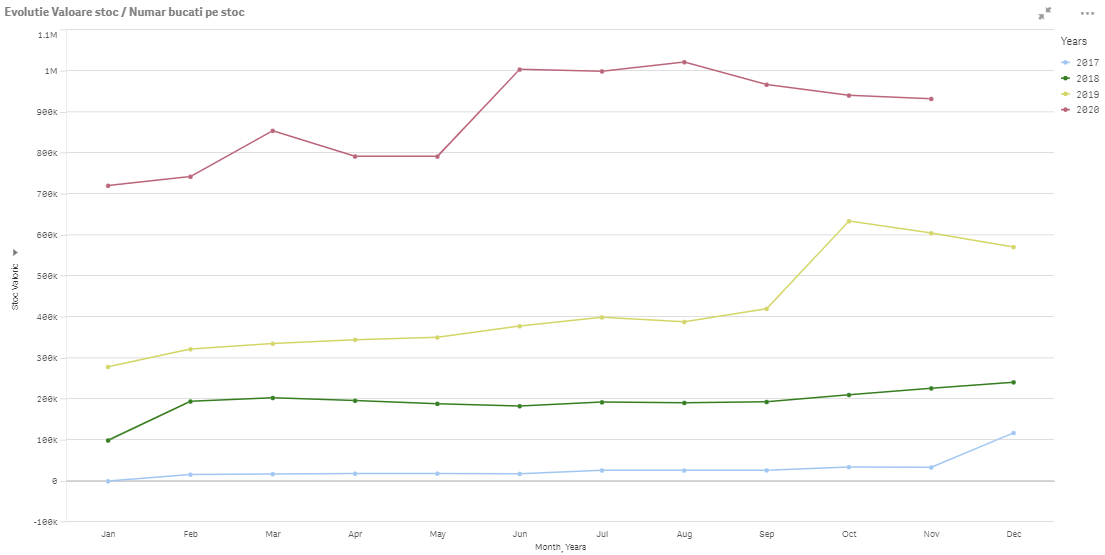
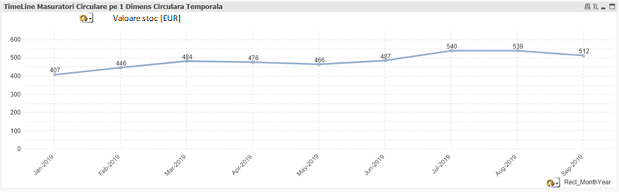
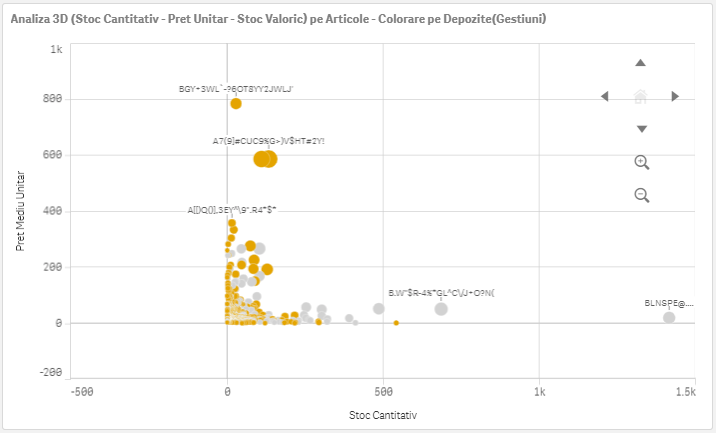
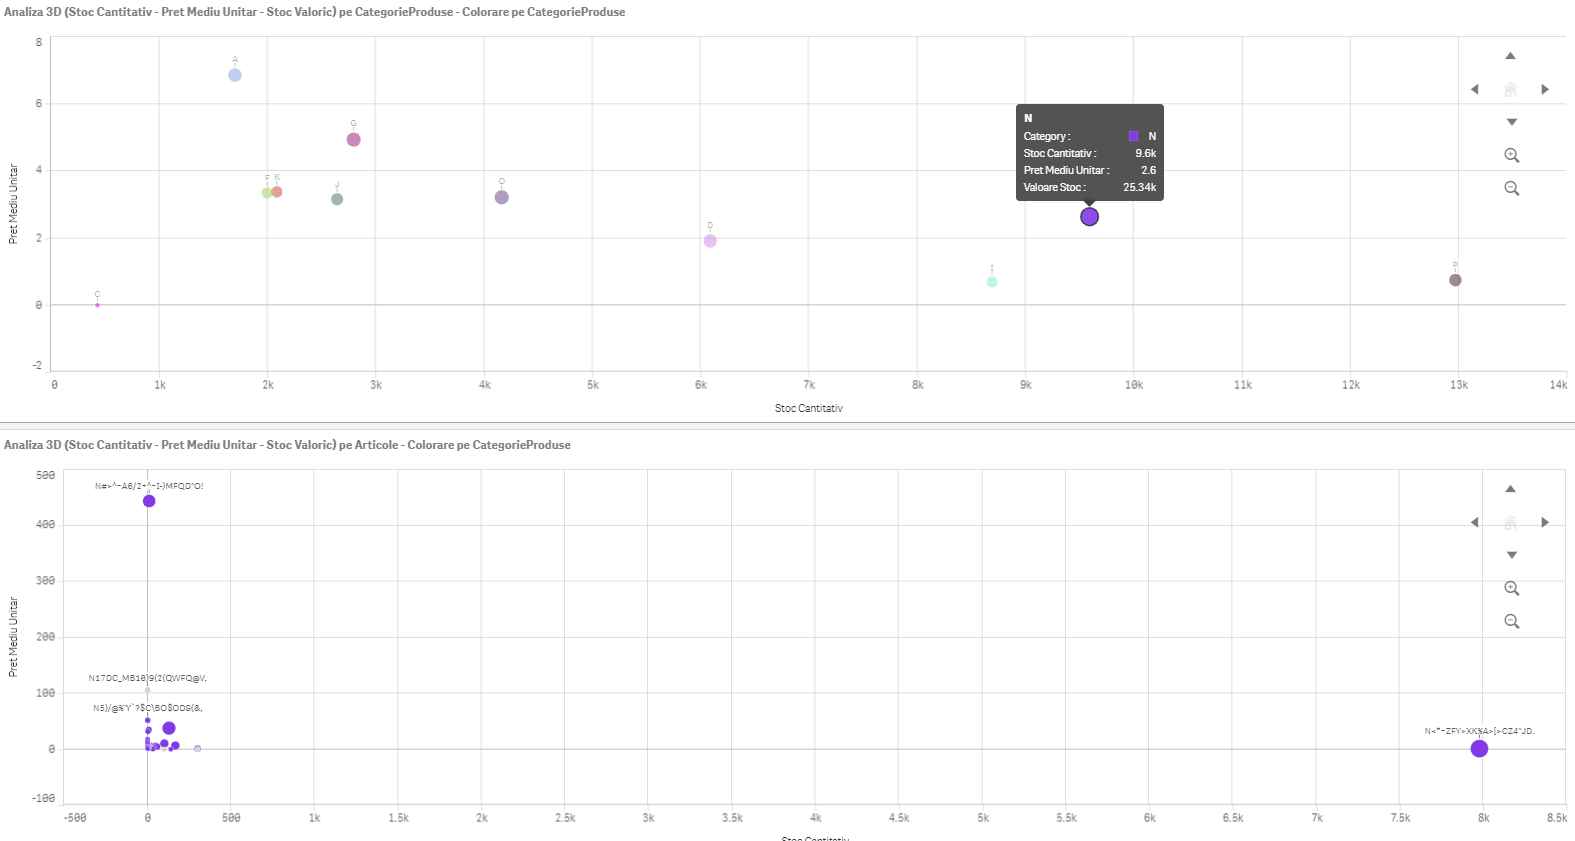
Stock Analytics
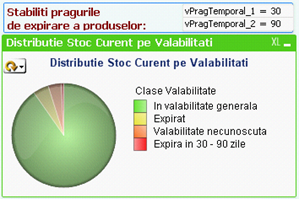
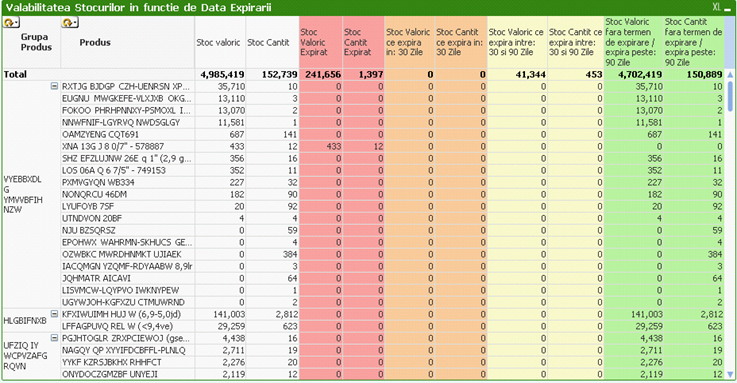
Stock Expiration Analytics
A package of views that highlights, for perishable products in stock, the situations of expiration, but also generates a pre-alert for situations in which the expiration will take place in less than a number of days set by the user.
Synthetic analysis
Detail analysis tables
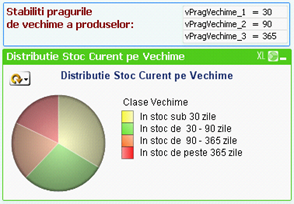
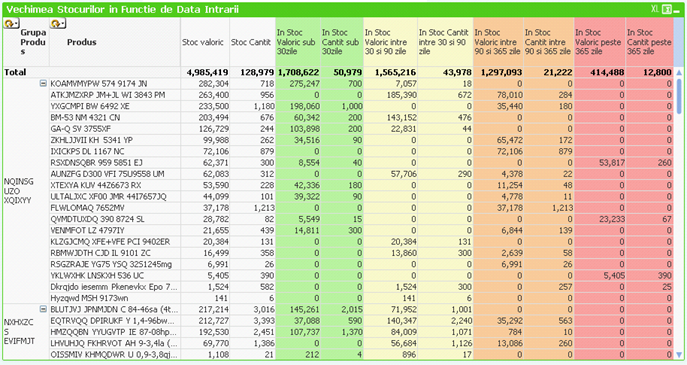
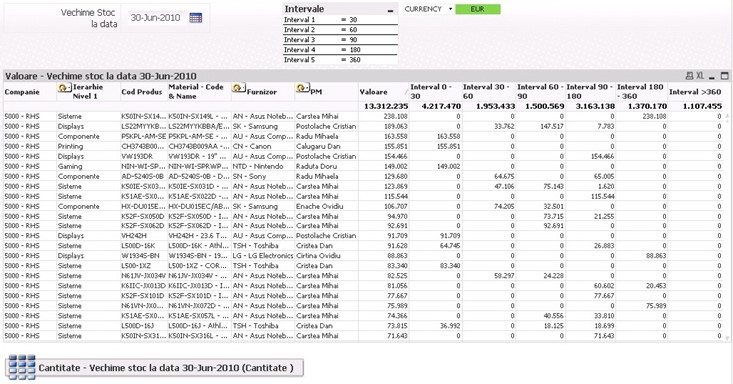
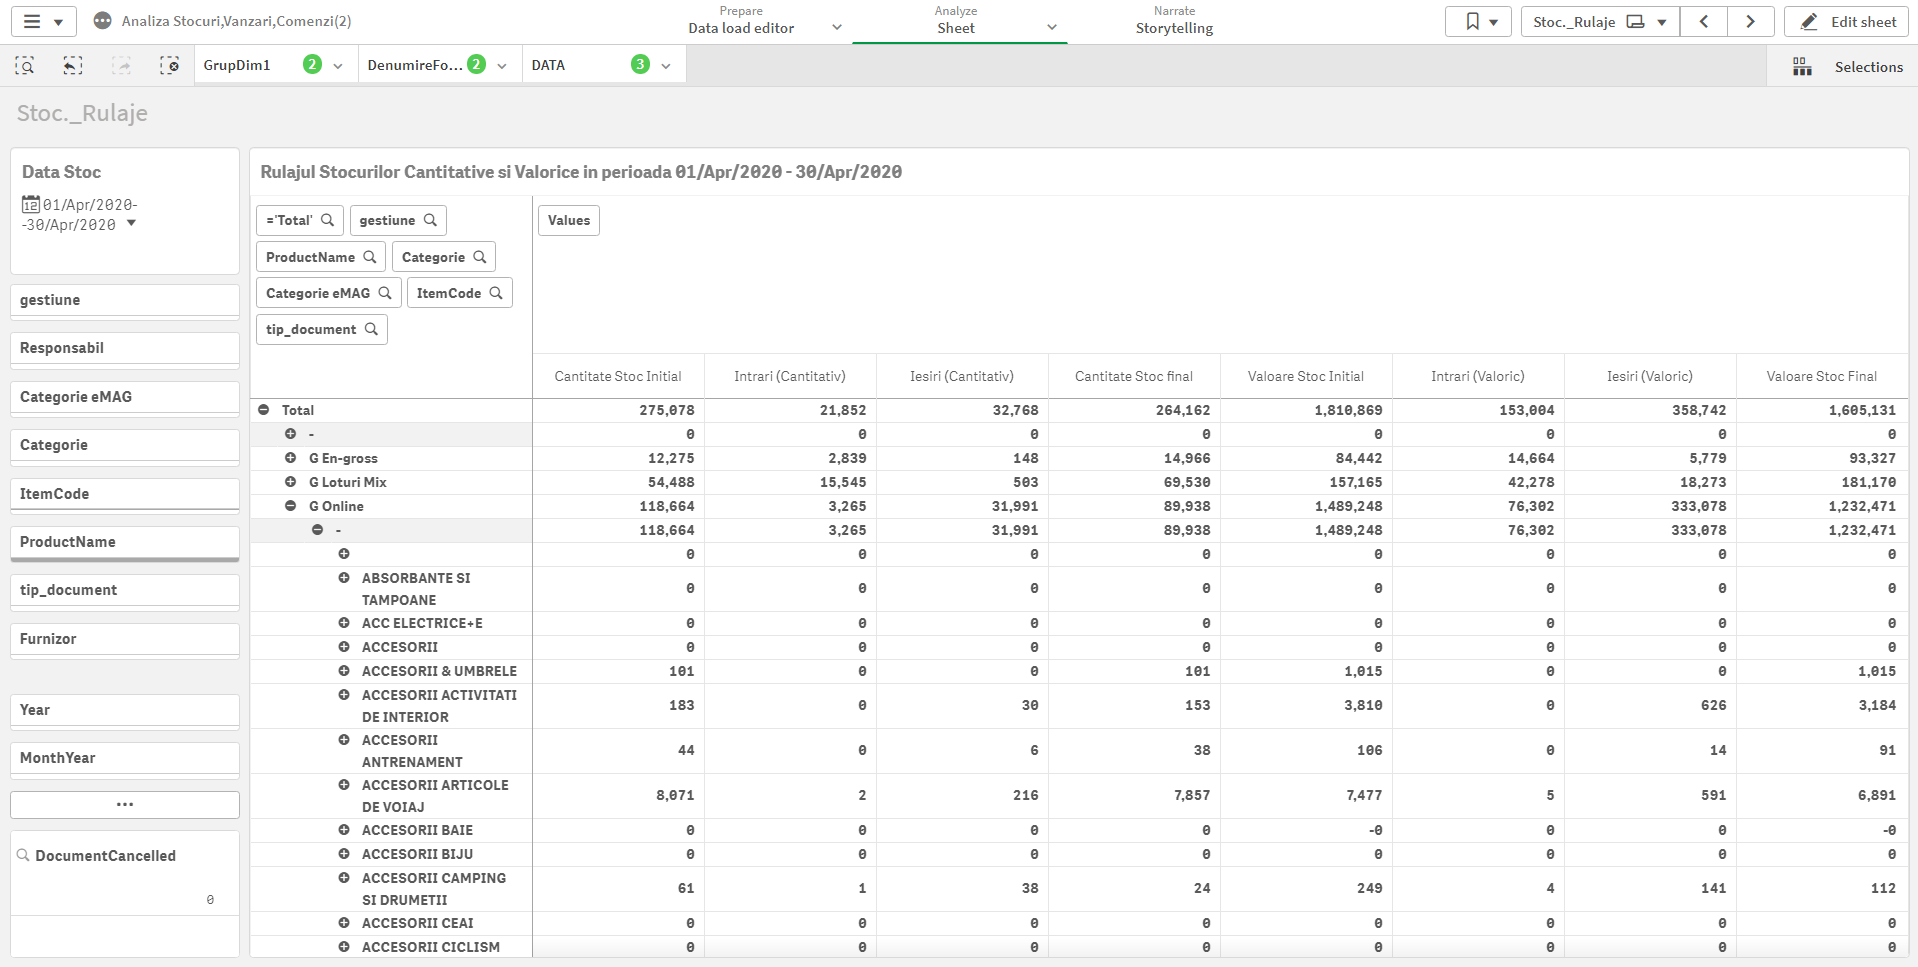
Aging Reports
It is an analysis that highlights the distribution of the stock by its age.
It can be calculated and presented synthetically, in the form of a number average days of age, calculated by weighting the age of each item in stock, with its purchase value. It can be aggregated at any level of detail (company/ management/ item classifications/ suppliers/ etc.).
It is also possible to report aging that highlights for each article/ classification of articles/ management/ etc. stock distribution (value or quantity) by analysis interval.
The identification of age can be done both if the ERP system keeps track of the stock at batch level and when there is no such traceability, applying in this situation various algorithms for reconstructing the age (the most common is the LOLI algorithm, a FIFO recalculated from current stock back, based on back entries).
Stock analytics can be done for both current stock and stock calculated at a date that has been set by the user.
Synthetic analysis
Detail analysis tables
Value and quantity of sale by age intervals
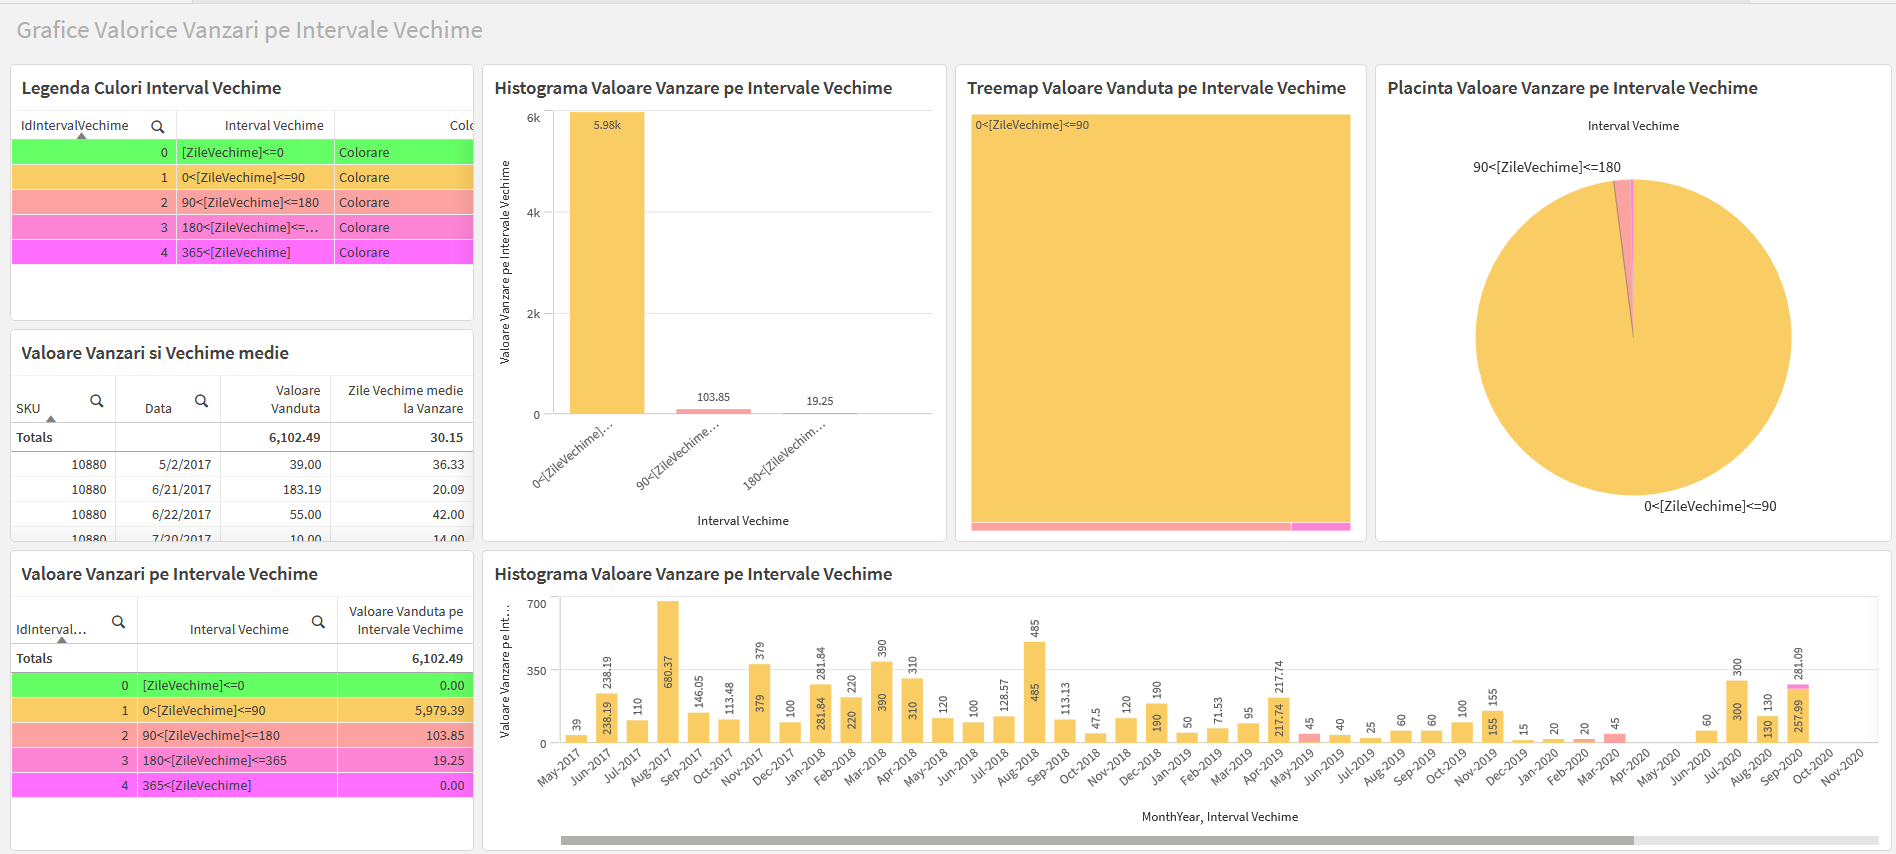
Sale value by age inervals
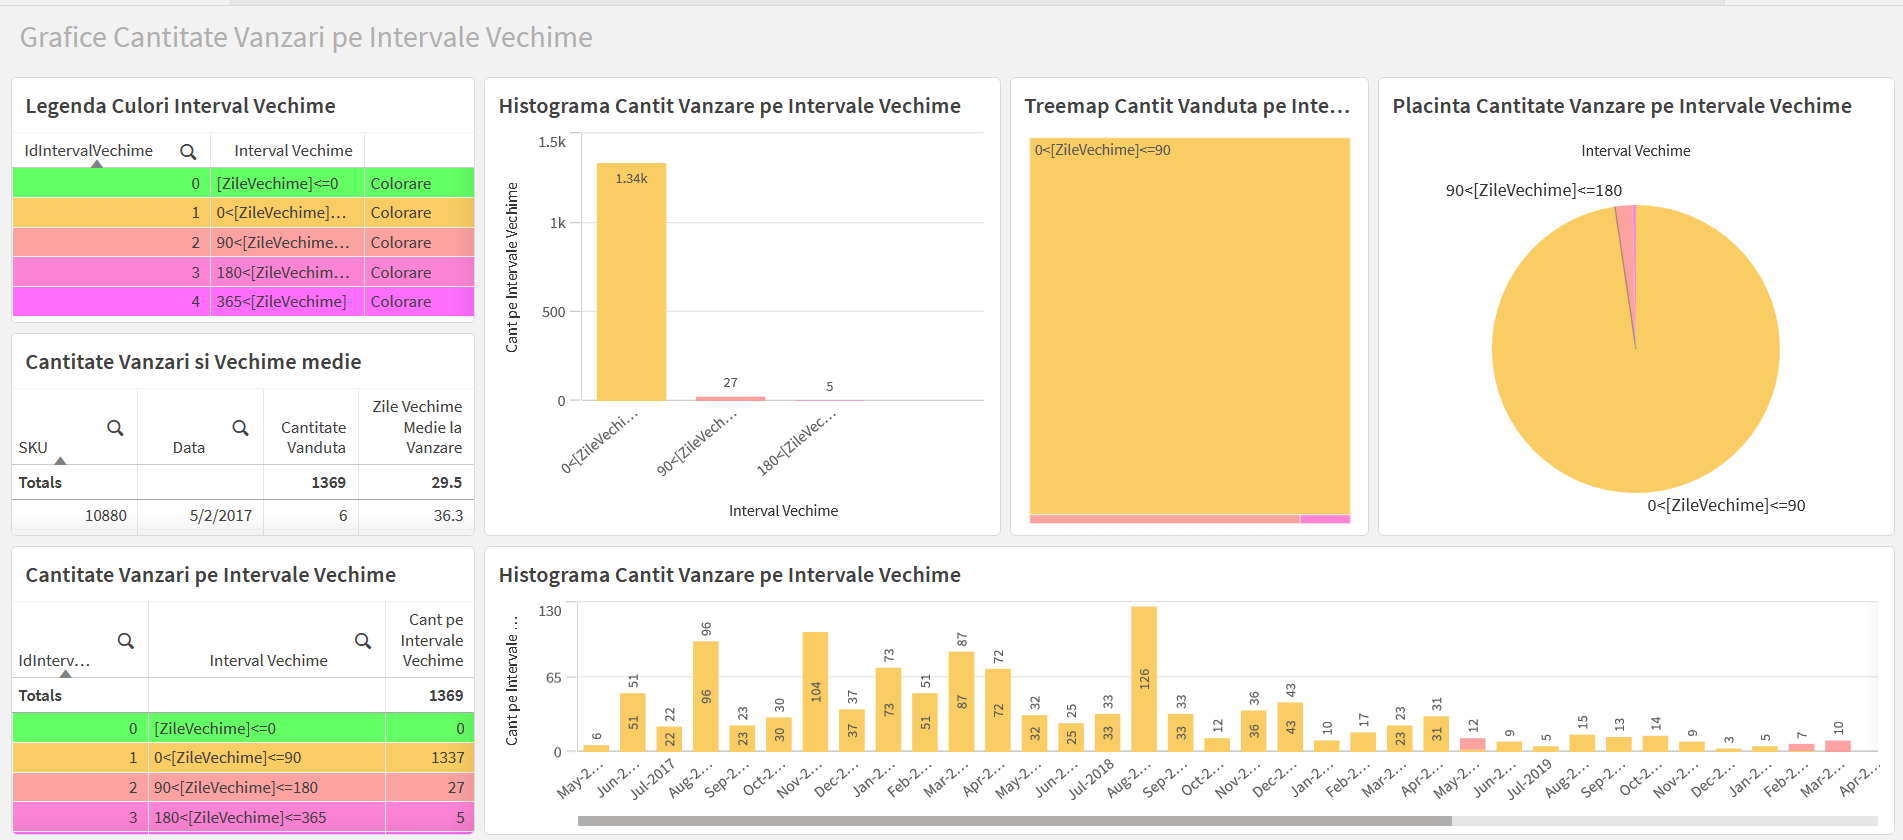
Quantity sold by age intervals
Value and quantity of stocks by age intervals
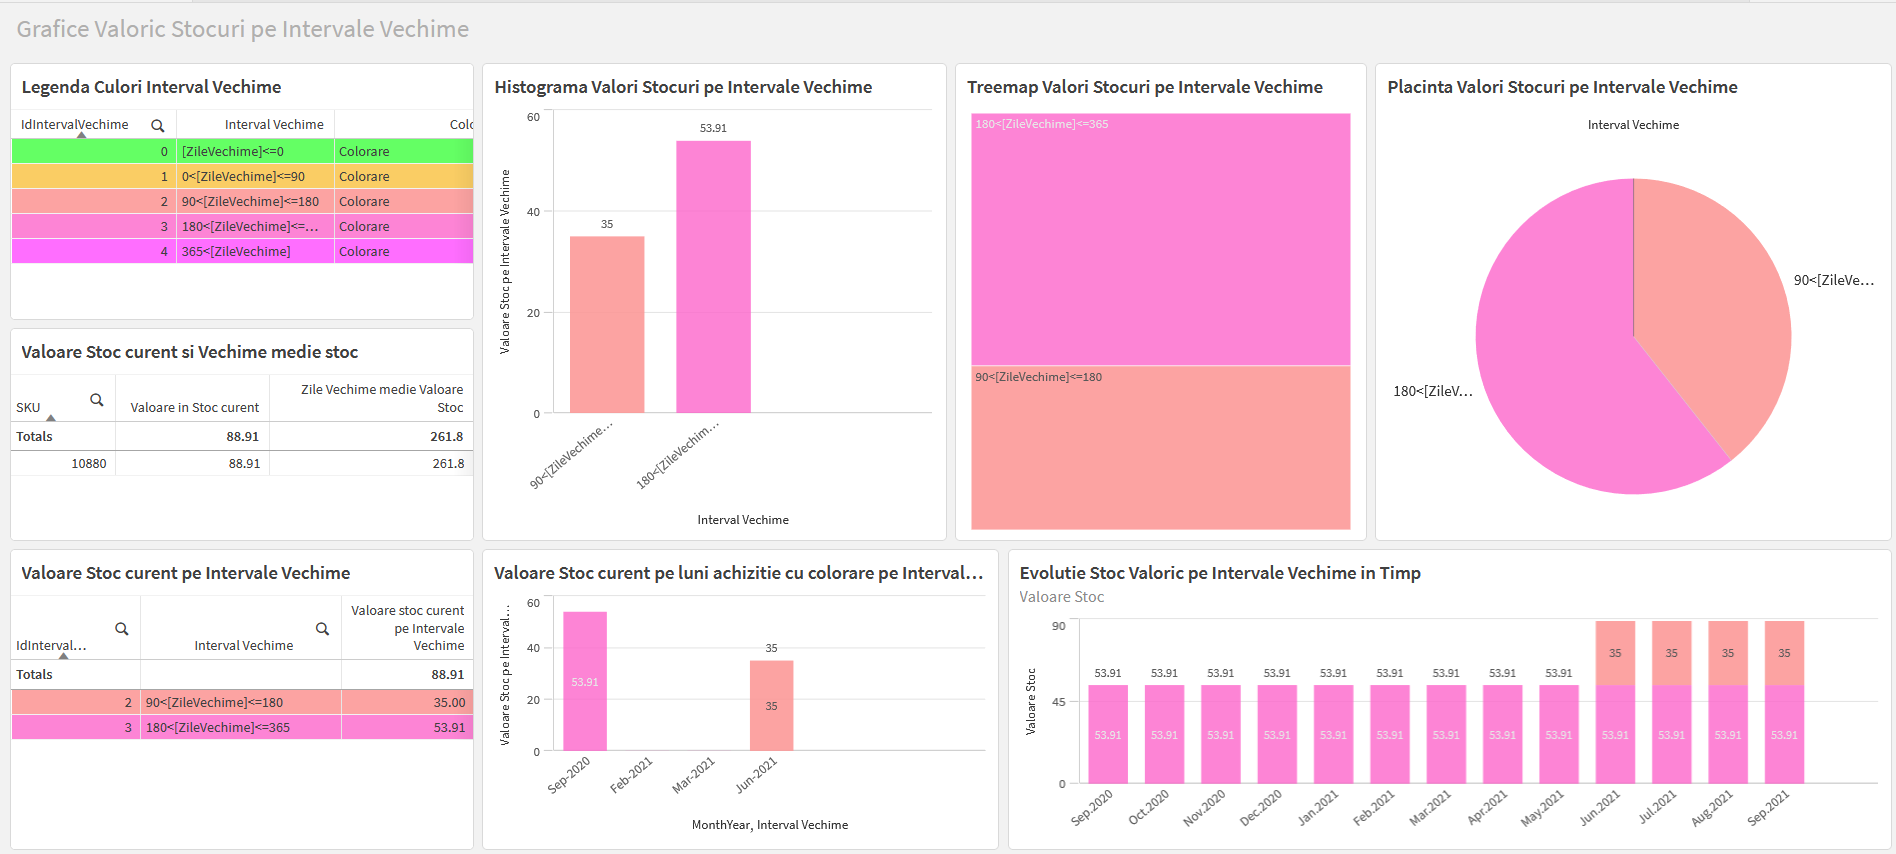
Stock value by age intervals

Quantity of stocks by age intervals
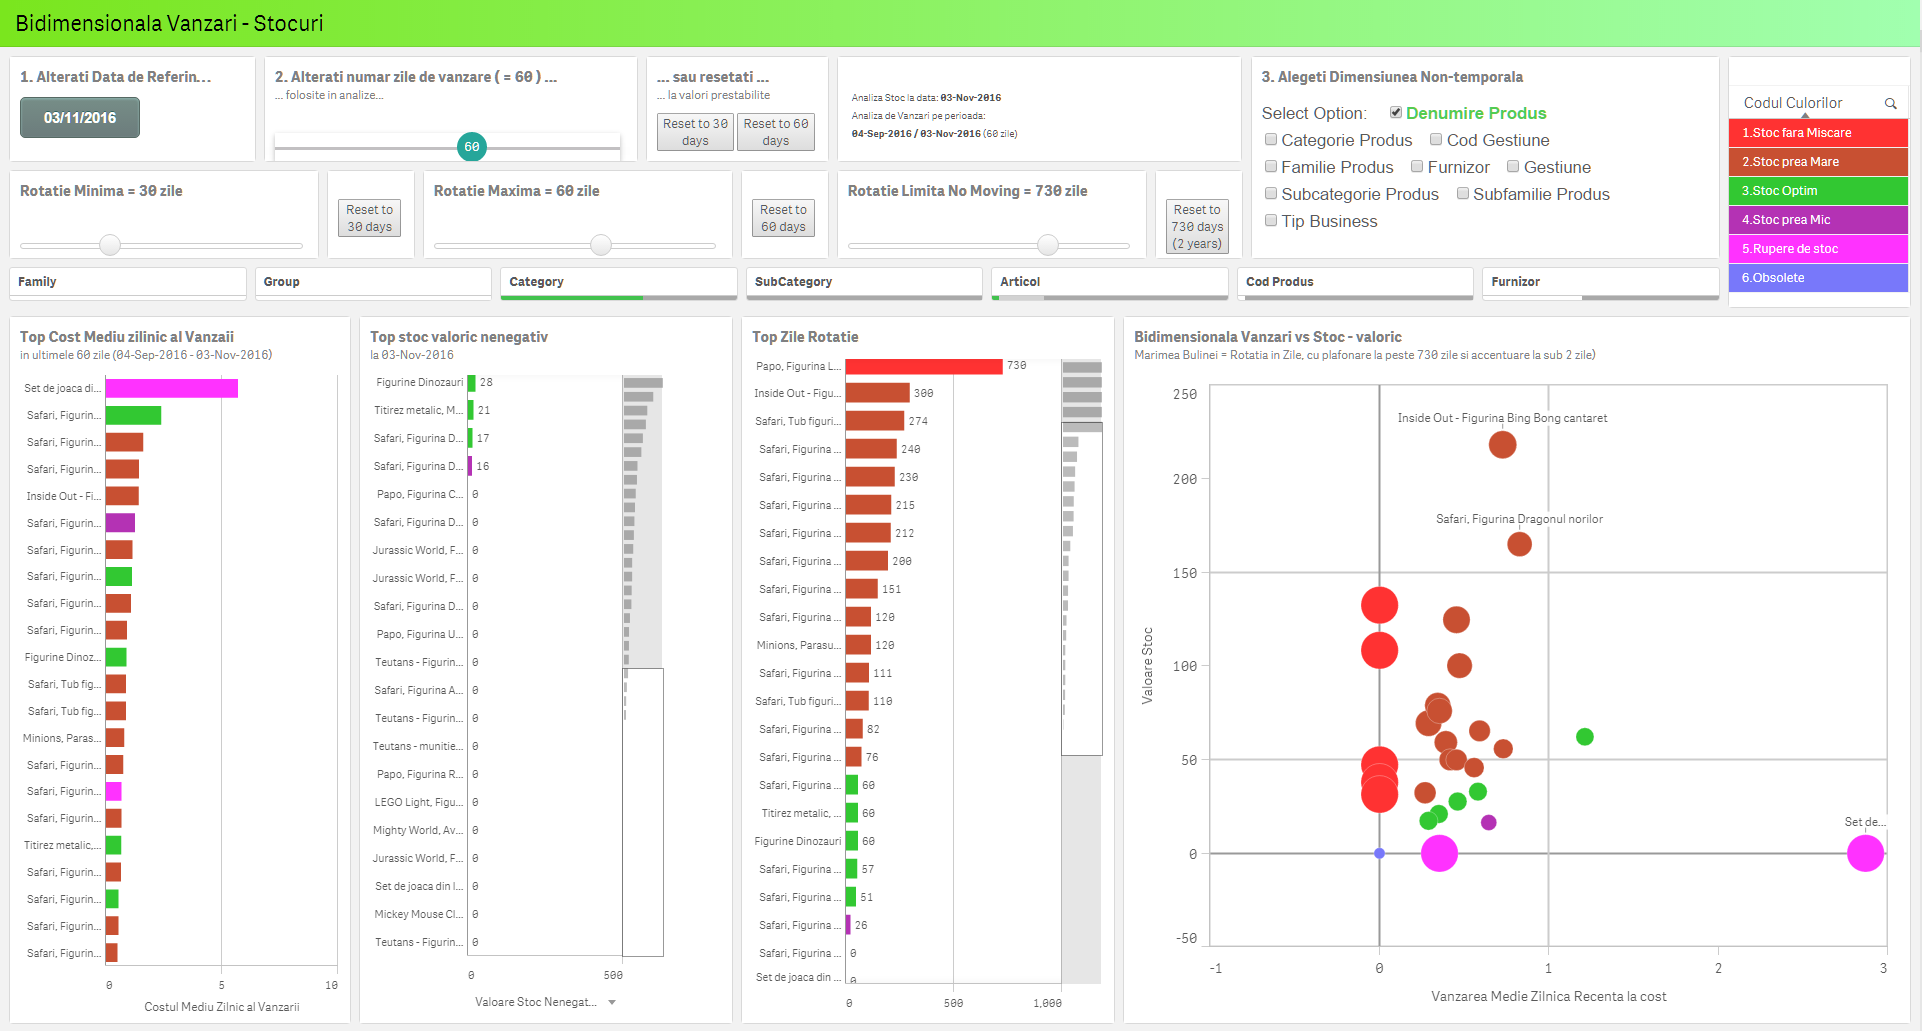
Analytics of Correlation of Stocks with Sales
Correlated Analytics Stock – Sale – Rotation Speed
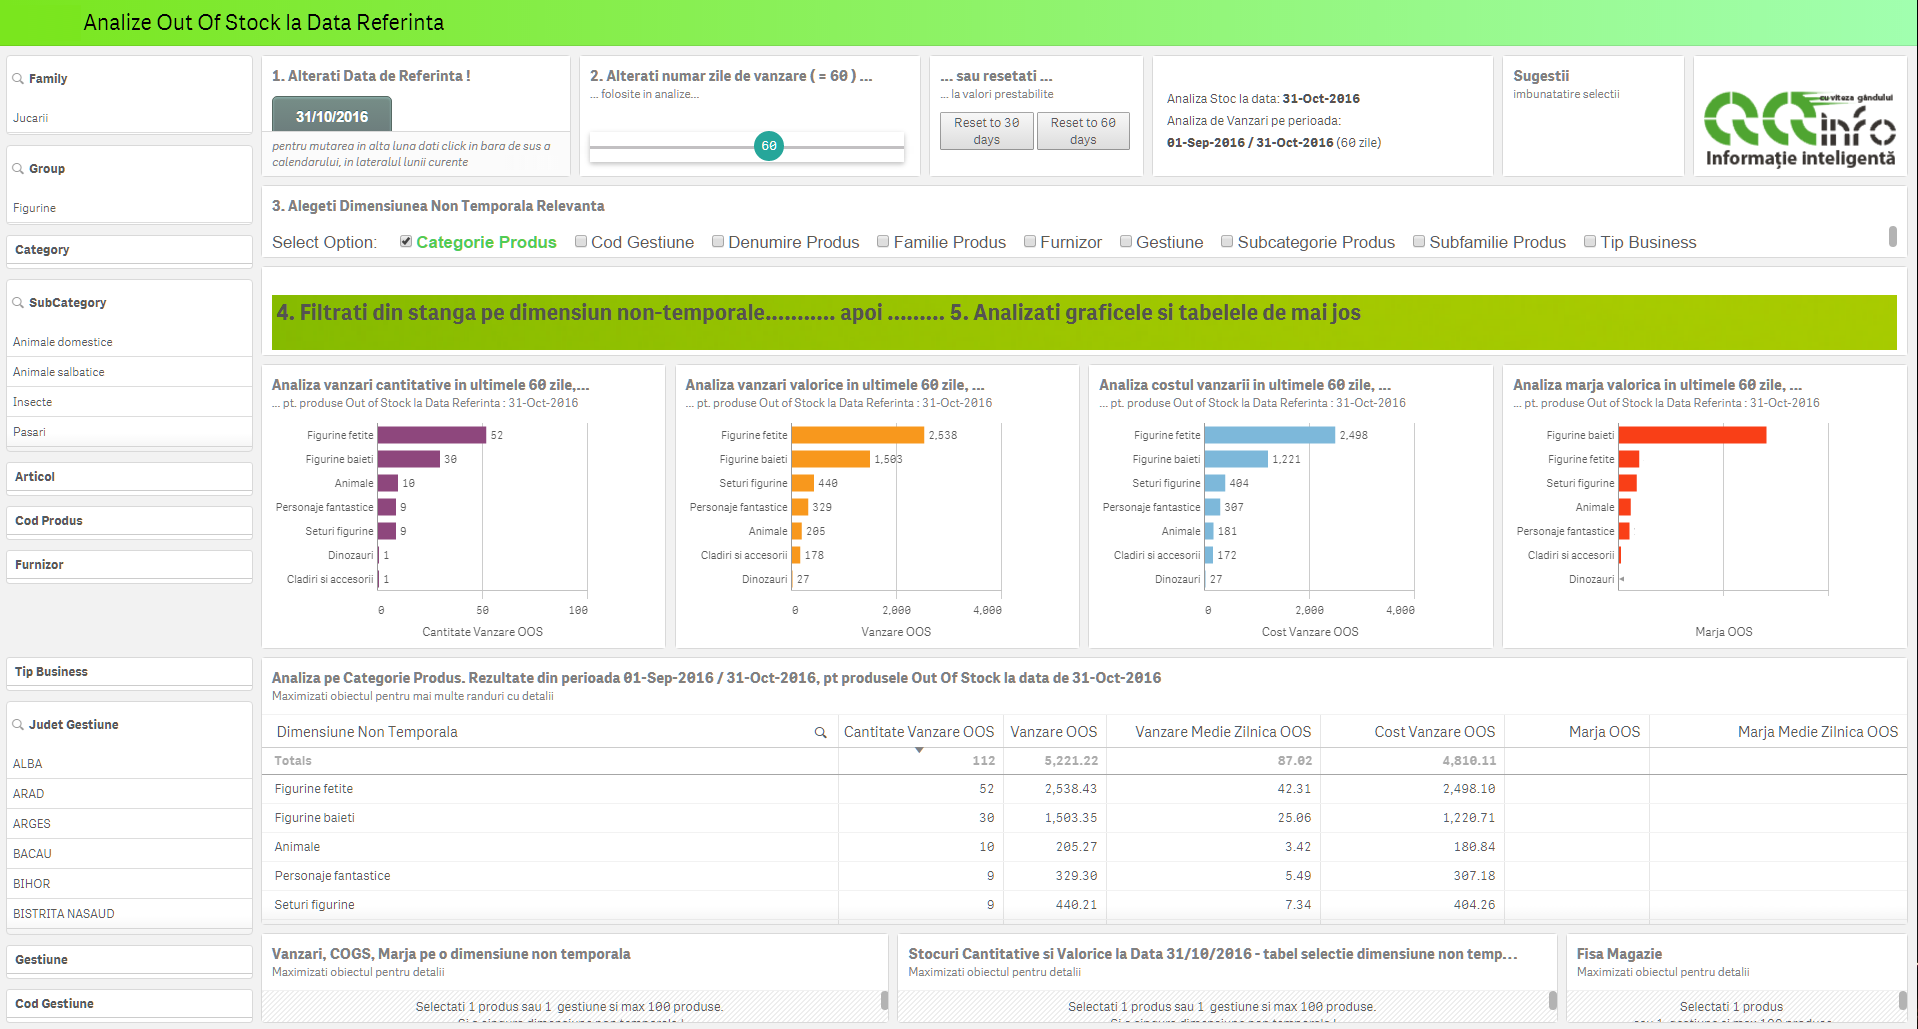
Alert analysis, to identify critical situations, in which there is a risk of imminent losses due to Out Of Stock (OoS) situations.
It allows the prioritization of particular situations according to the most relevant criterion (usually lost margin), thus adding value by focusing the analysis in the order of importance of the amount at stake.
Notes:
- The analysis interval in which the sales are considered is a parameter that the user can adjust according to the needs of the moment.
- If structured information about orders placed with the supplier is available, we can filter these alerts, identifying only those that have not yet placed the order with the supplier (additional option not included in the offered budget).
- What the quantitative alerting limit means (OoS can be moved from zero to a user-set amount).
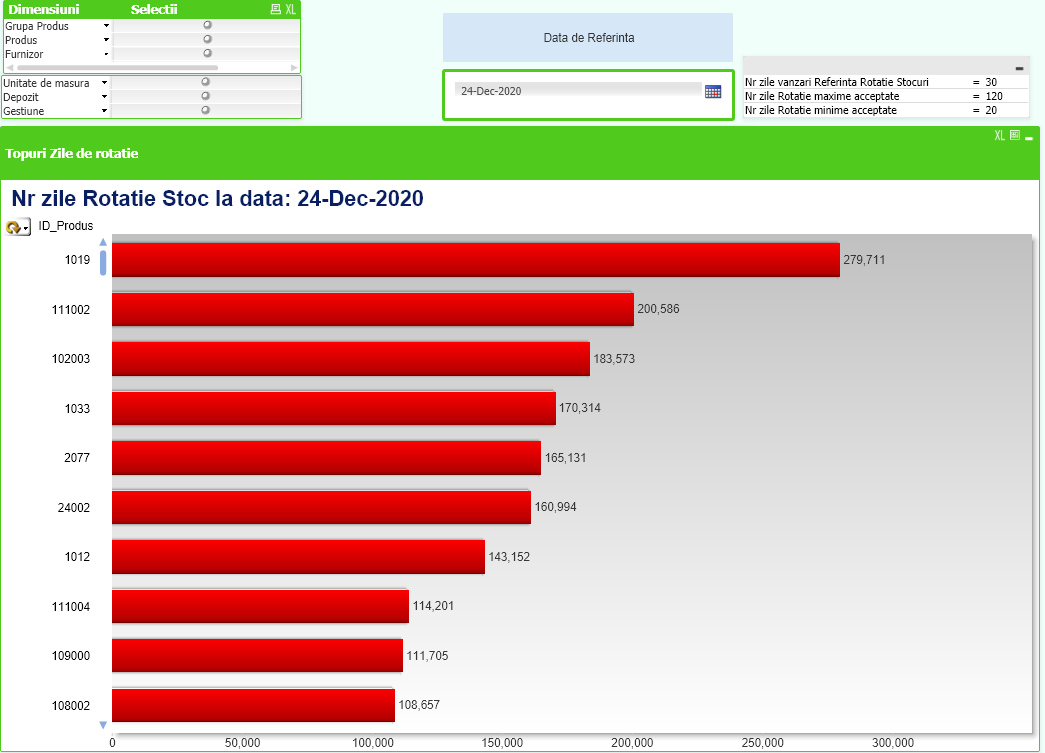
Rotation Ranks at Current Date
Tabular analytics of speed rotation
Out of Stock Analytics (OoS)
Compound analysis page
Alert analysis, to identify critical situations, in which there is a risk of imminent losses due to Out Of Stock (OoS) situations.
It allows the prioritization of particular situations according to the most relevant criterion (usually lost margin), thus adding value by focusing the analysis in the order of importance of the amount at stake
Notes:
- The analysis interval in which the sales are considered is a parameter that the user can adjust according to the needs of the moment.
- If structured information about orders placed with the supplier is available, we can filter these alerts, identifying only those that have not yet placed the order with the supplier (additional option not included in the offered budget).
- What the quantitative signaling limit means (OoS can be moved from zero to a user-set amount).
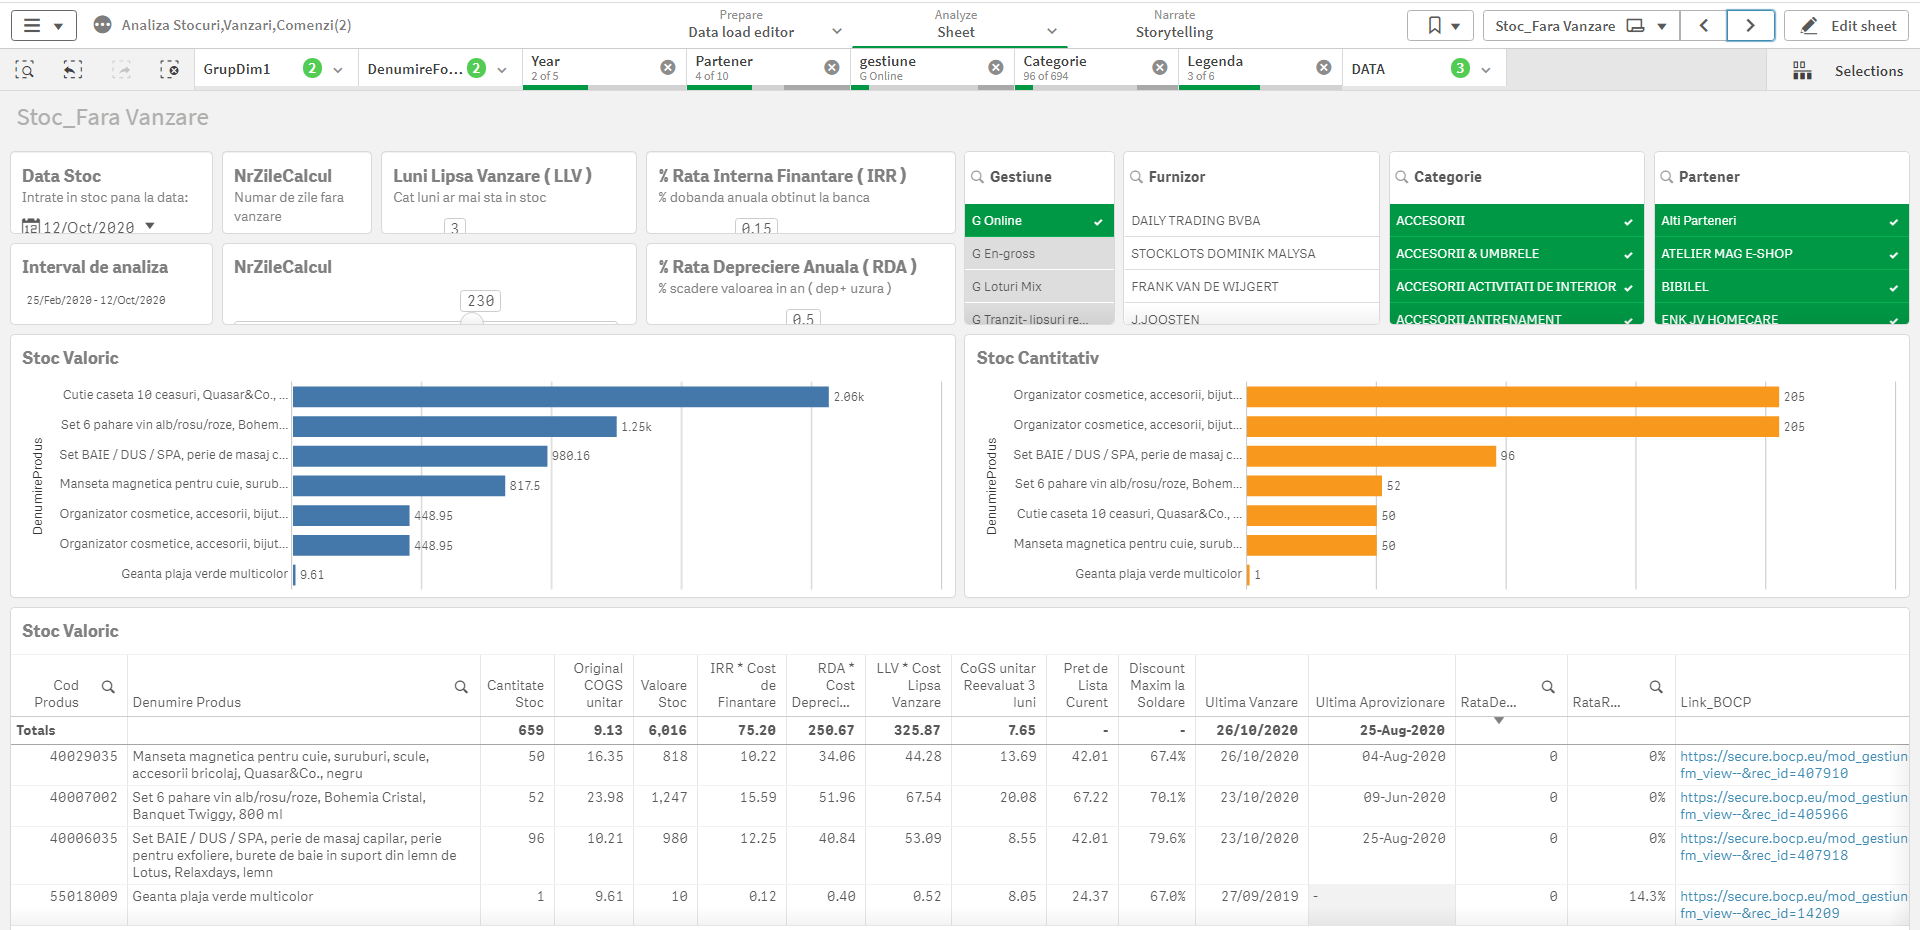
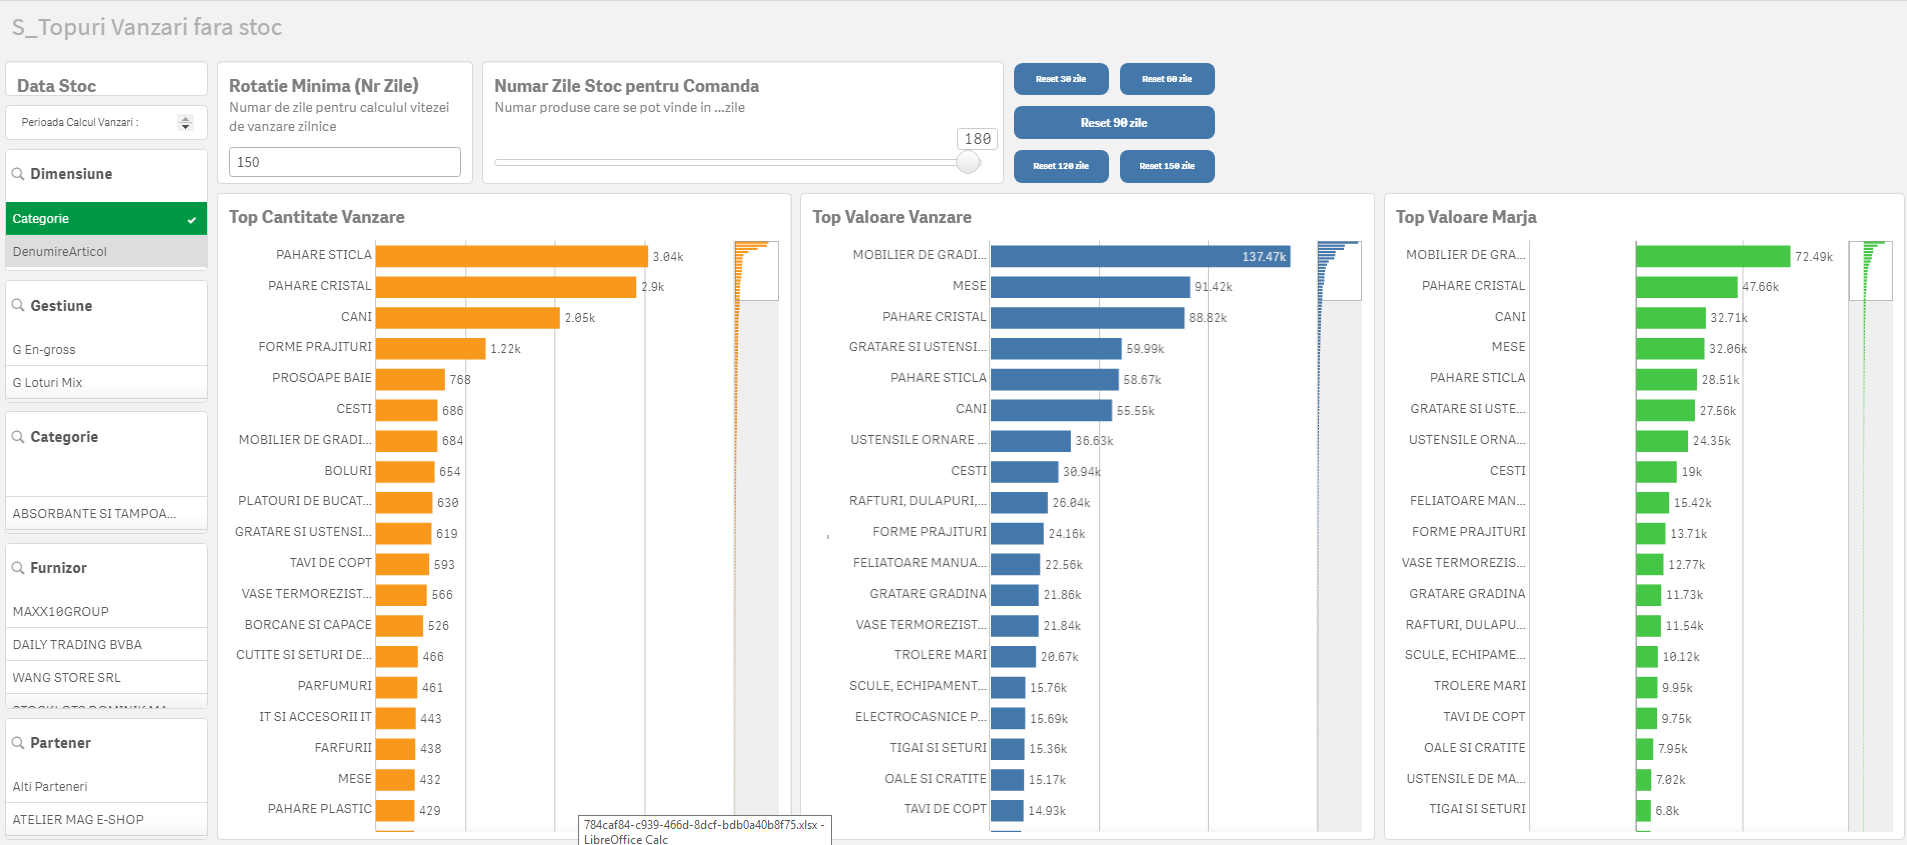
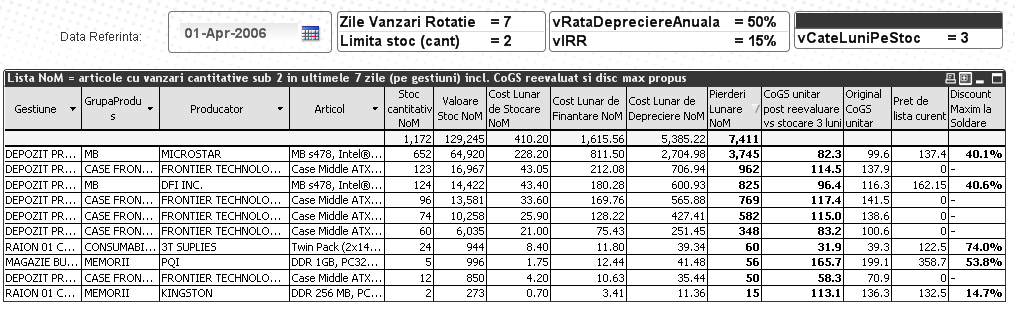
Stock without Sales in the last period and calculation of maximum welding percentage for stock liquidations
This alert analysis allows the user to take concrete actions to weld the items that are close or have already entered the NoMoving state, immediately offering the reasonable variation limits of the welding price and the maximum discount that makes sense.
The system also takes into account a number of configuration parameters available to the user (how many days of past sales take into account, how many months of storage are taken into account to identify the new re-evaluated cost of welding), but also a number of parameters which can be modeled at a general level, editable by the user, or automatically calculated according to the classes of membership of the articles and / or evidences, such as the volume of the article, storage cost per unit volume.
The analysis may consider NoMoving to be a non-zero quantitative minimum sale or a finite minimum turnover.
Optionally, you can decide the date on which the calculation will be made (roll-back option).
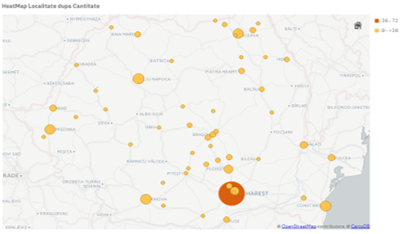
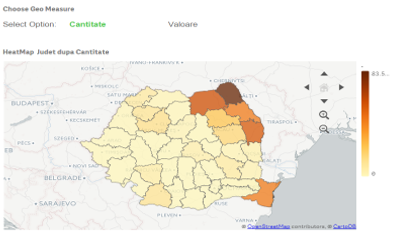
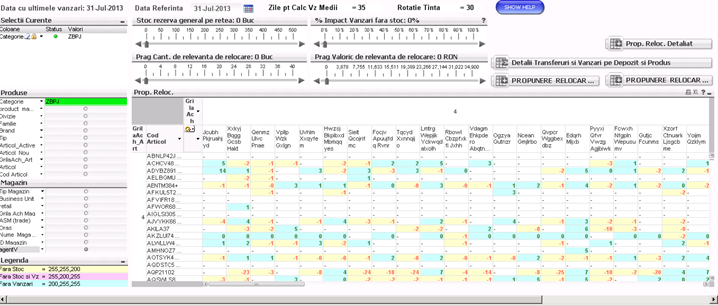
Relocation Analytics
Compound analytics page
Relocation suggestions*
It is a relevant analysis for companies that carry out their activity with several management locations distributed in the territory.
The solution automatically proposes the quantities to be relocated to optimize the current stock placement in line with recent sales results.
The special OoS and NoM situations are alerted by colors (editable), which alter the starting parameters of the calculation.
The quantities “to be received” and “to be given” are visually explicit both quantitatively algebraically (minus = amount to be given / plus = amount to be received) and chromatically (green => to be received, red => to be given).
Optionally you can add a view on the map, with 2 different colors of the quantities to be received and given.
* It is not necessary to manage a complex set of parameters. On request, only global parameters can be defined:
- the date on which the stock is taken into account (it is the current date in the default solution, but in some systems another previous date can be chosen);
- the sales period to be taken into account – either as duration in days past the current date (default solution), or as starting date and ending date;
- value and / or quantitative relevance thresholds (general or by categories).
Final Recommendations
If the presented set of analytics is not enough for an optimized inventory management, we recommend its extension with the set of advanced analytics for correlating stocks with sales:
About QQinventory.healthcheck™ you can find more details here: qqinfo.ro/QQinventory.healthcheck™
More details about QQinventory.prevention™ can be found here: qqinfo.ro/QQinventory.prevention™
To structure an optimized system of supply and allocation orders, we can assist you with solutions tailored to specific needs, including an integrated mix of Visual Analytics, Data Science, Machine Learning and Artificial Intelligence tools along with organizational methodologies to bring to the organization the maximum possible beneficiary of efficiency and understanding, with minimal risks, at the same time.
To find out more about the stock management solutions suite, we invite you to fill out the form here and we will contact you to set up a meeting where we will present concrete examples or even a dedicated pilot project.
For specific and specialized solutions from QQinfo, please visit the page: QQsolutions.
In order to be in touch with the latest news in the field, unique solutions explained, but also with our personal perspectives regarding the world of management, data and analytics, we recommend the QQblog !