(QQbasket.analytics™ is an extension for QQsales.margin™)
Basket composition analytics were initially developed by large retailers to identify natural trends of product association by including them by the consumer in the same shopping cart.
The solution can be implemented in less than 1 day over any Qlik™ reports (QlikView™ or Qlik Sense™) with data extracted from transactional systems (ERP/ CRM/ SFA/ SCM/ WMS/ etc.).
The solution is even more valuable if you already have QQcosmic.interface™ implemented in a Qlik™ analysis application, with departure data, offering more options for immediate transformation of the Basket Analytics analysis package.
QQbasket.analytics™ extends the concept, offering users, directly in the interface, the option to choose the correlation element, beyond the established option (tax receipt/ invoice).
Steps to Follow
- Choose the common analytics aggregation denominator (usually the bill or invoice id);
In some industries and situations, this criterion can be changed to a composite criterion, for example, in distribution, it could be IdClient + AnLuna. - Define the analysis context (time and non-time size selections);
- Choose the products you want to be the drivers for defining “baskets” for analysis (bills & invoices/ etc.);
- You already have a first set of general information, regarding the total sales recorded in the associated baskets.

5. Choose from the desired starting basket analysis measures:
1. Sale Quantity intra – basket
2. Sale Value intra – basket
3. Intra – basket GM Value (trade margin)
4. Intra – basket GM percentage (percentage trade margin)
5. Value intra – basket Discounts
6. Percentage of the intra – basket discounts
7. Value of the cost of intra-basket goods
6. If necessary, you can add other dimensions of the analysis, which assess, on the one hand, the importance of selected items in the total baskets, and on the other hand, the importance of sales from selected baskets in total sales on basket products.
- Multiplication factors between the total baskets and the values related to the selected items (by quantity and sales value, but also by trade and percentage margin, or even by discount and percentage discount or cost of goods).
- Percentage of achievement in the analyzed baskets versus total sales on all products in the baskets (again on quantity and value of sale, trade and percentage margin, discounts or cost of goods).
Percentage no. of bills in the analyzed baskets versus total no. of vouchers on all products in the baskets.
For all these analytics, of course, the context of temporal and non-temporal filters (extra product) defined in the selection is considered.
- View, in various formats, the business results of all products in the same baskets (on the same invoices/ bills) as the selected products (for the selected period and sales units).

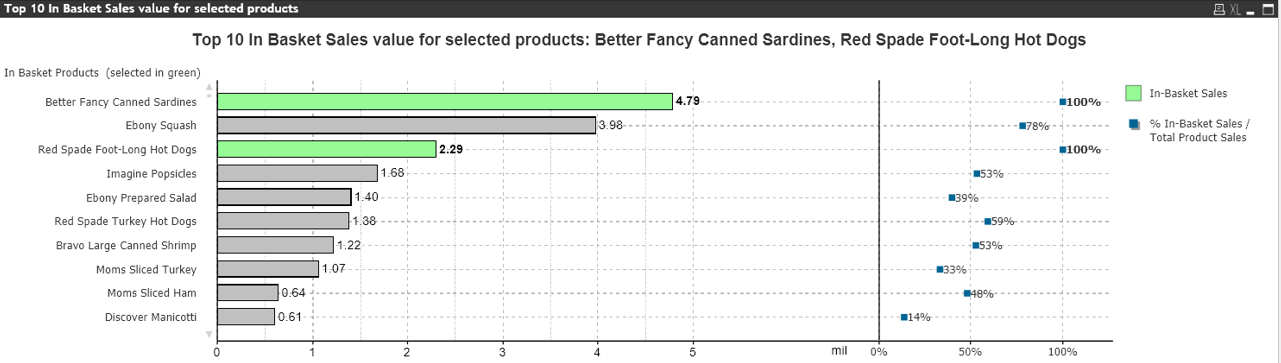
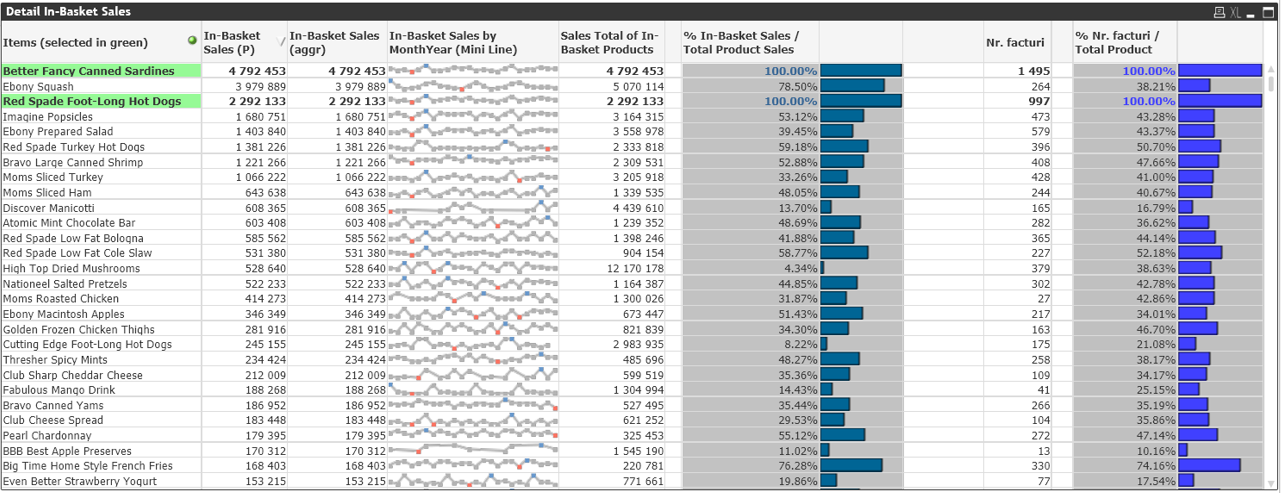
(The items chosen in step 3 above, are marked in green in the graphs above)
For information about Qlik™, visit this page: qlik.com.
If you are interested in QQbasket.anaytics™ product, or you need more information, please fill in the form here !
In order to be in touch with the latest news in the field, uniques solutions explained, but also with our personal perspectives regarding the world of management, data and analytics, we recommend the QQblog !