QQgeomarketing™ analytics bring the presentation of commercial information to another level, offering GIS representations, superimposed with concrete data extracted from ERP, combined with demographic information specific to cities (represented by GIS as points) or counties/ regions/ countries (represented by GIS as polygons).
Starting from the need to identify the geographically insufficiently exploited geographical areas, on a geographical presentation one can visualize various geo marketing information:
- sales;
- sales per thousand inhabitants;
- of customers or no. transactions or deliveries.
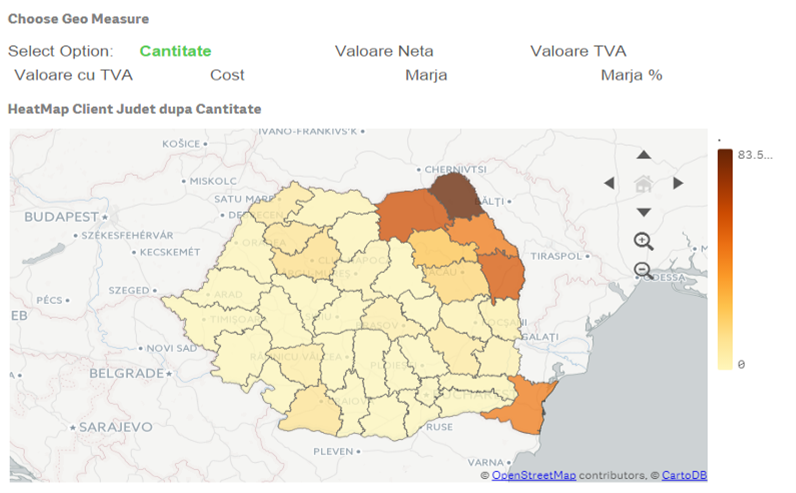
By Counties
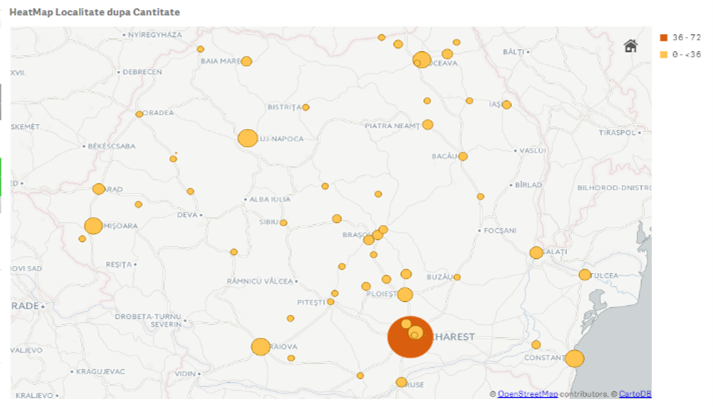
By Localities
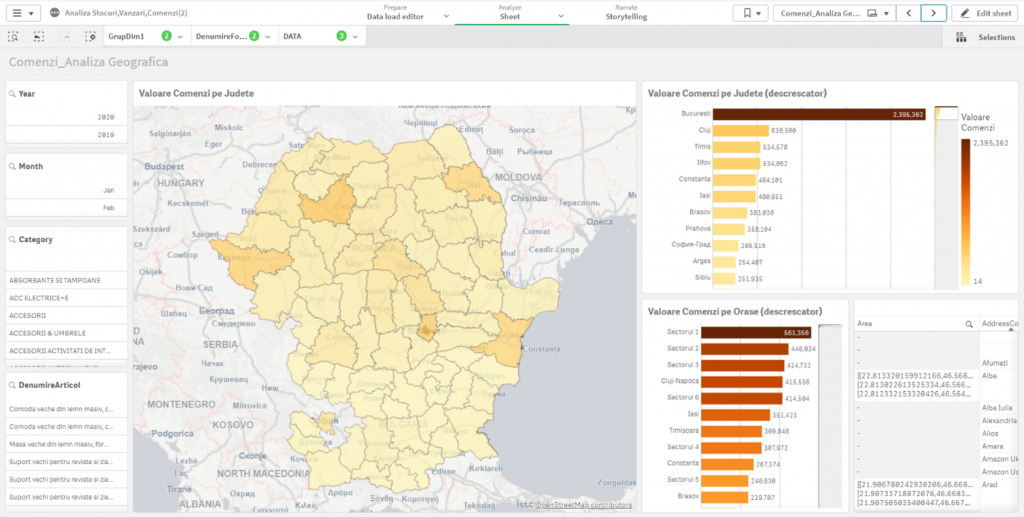
Requires ERP coding of transactions (or customers) at the desired level of geographic detail.
Generally, we recommend use at county level, but we have options to go down in detail both at city and villages level, depending on the specific business.
Other Analytics with Geo-Spatial Representation
Beyond the visual analytics mentioned above, the spatial correlation of the information contained in the growing sets of facts allows:
- integration with detailed GIS information, to identify the positioning and specificity of certain phenomena and properties, including analytics of commercial ford or competitive positioning in the territory.
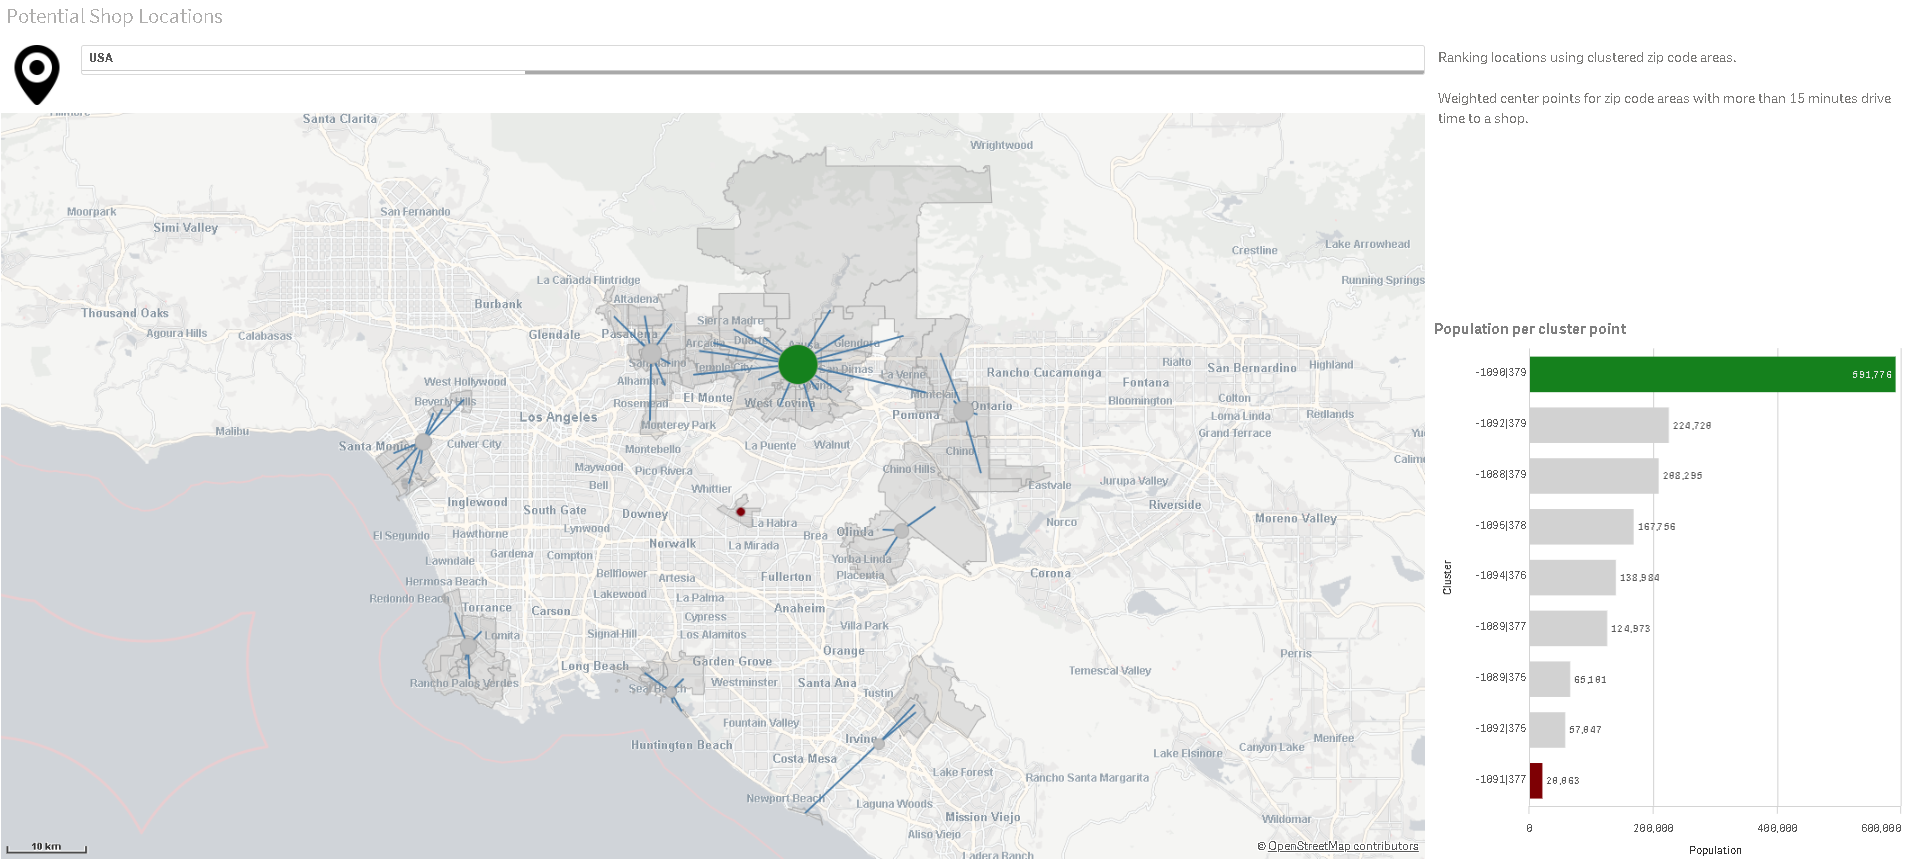
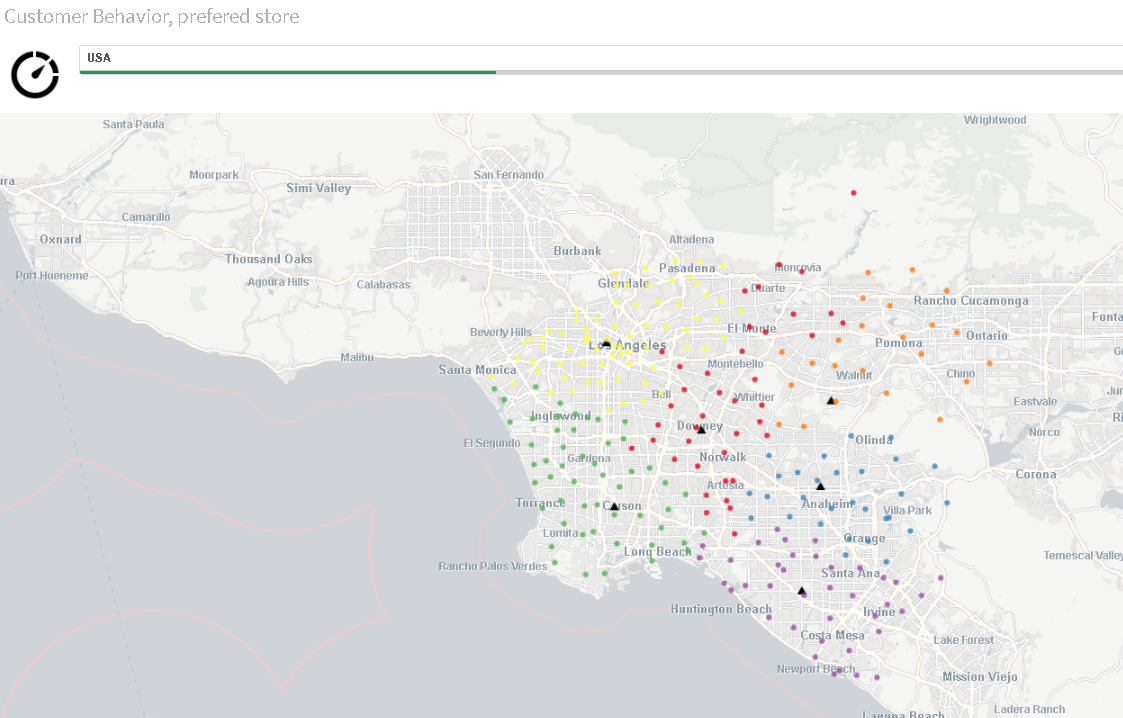
(examples of coverage area, distance analysis: Potential Shop Reach & Potential Shops & Preferred Shop)
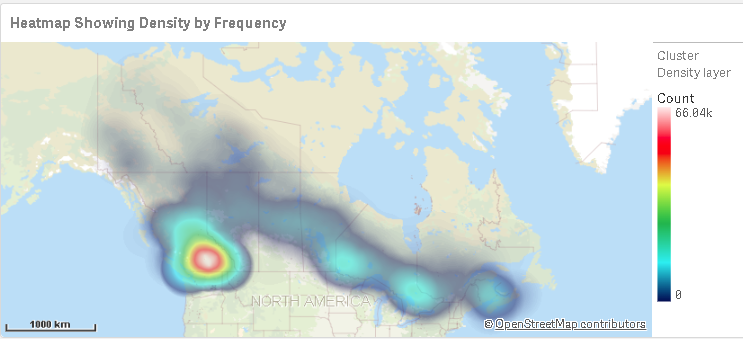
- identification of the spatial distribution of the densities of certain phenomena
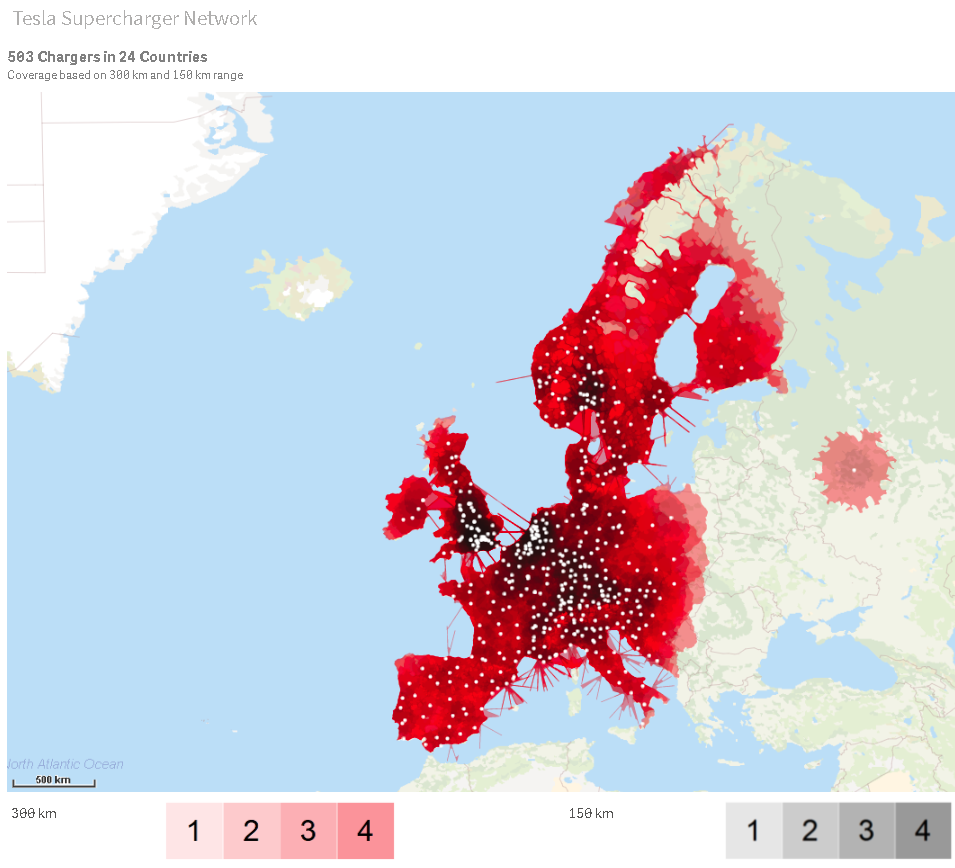
(example of heatmap + Ares+Dots+Line Tesla)
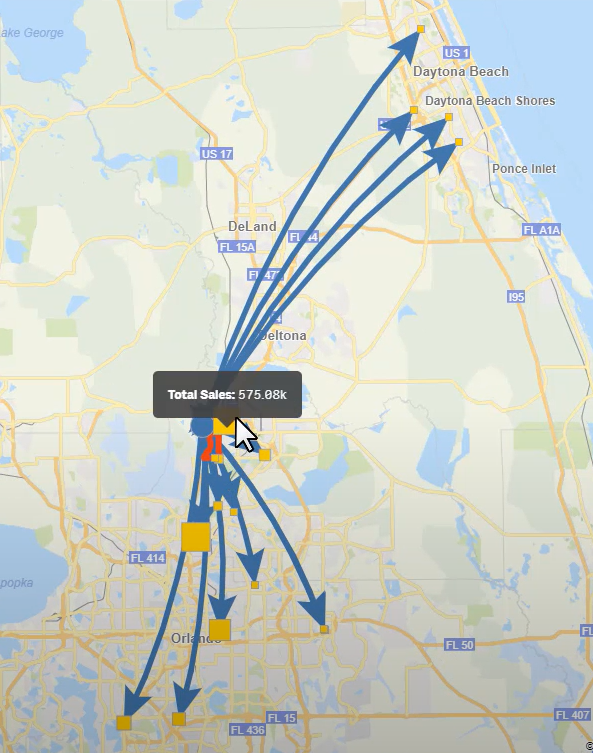
- highlighting the importance of phenomena with double geographical location (departure-arrival type)
(example Arrows+Squared)
- overlapping several information layers on the same map
(multiple examples: Areas + DensityHeatMap / incl above from Potential Shop Reach and Potential Shops)
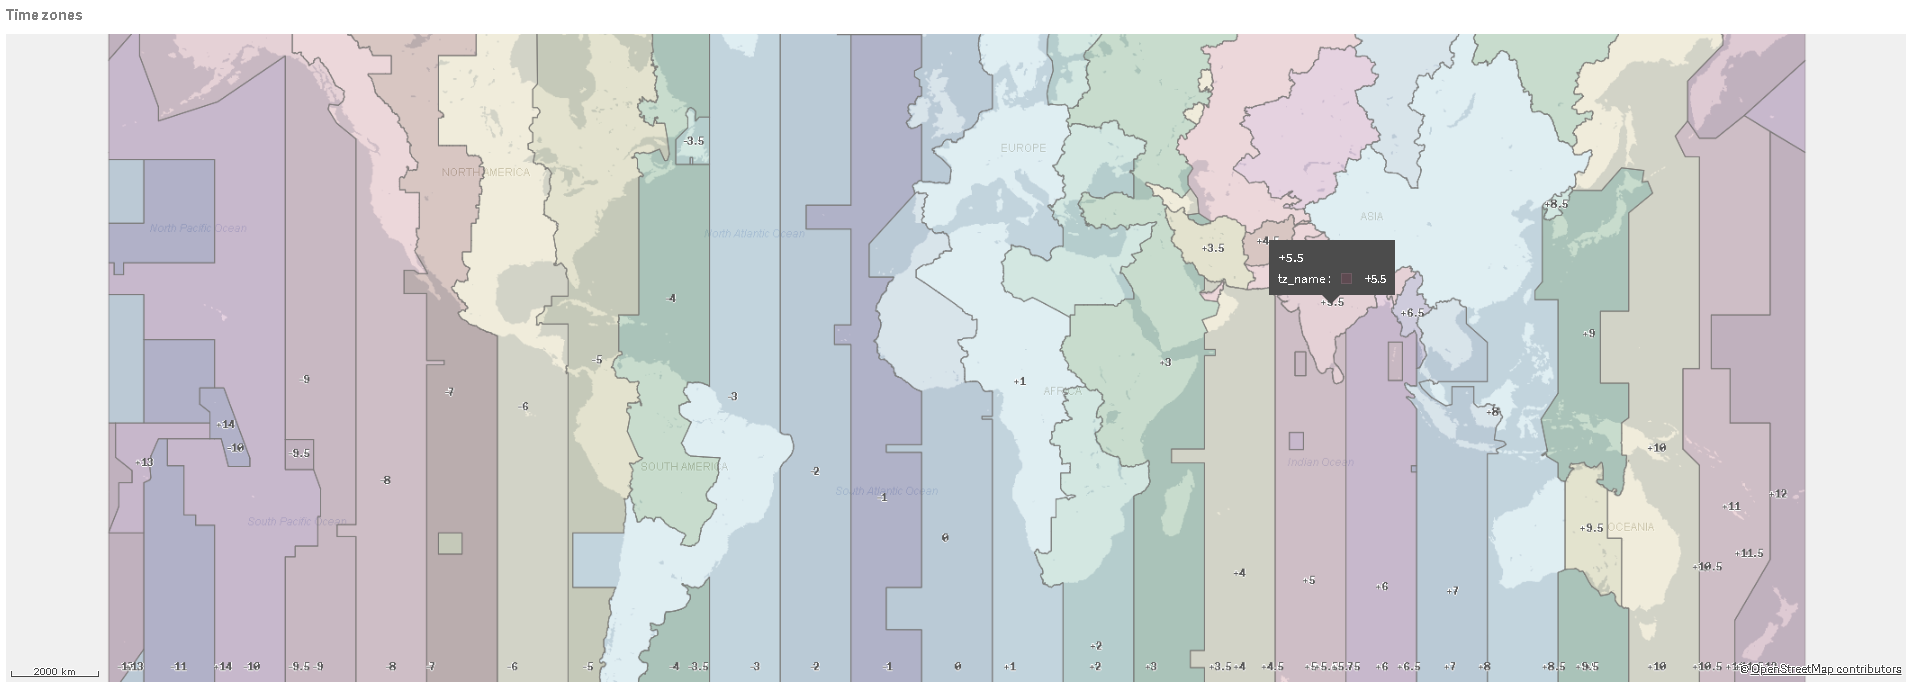
- geo-spatial representation of artificially- defined areas, suc h as semi-transparent time zones on world map (see below)
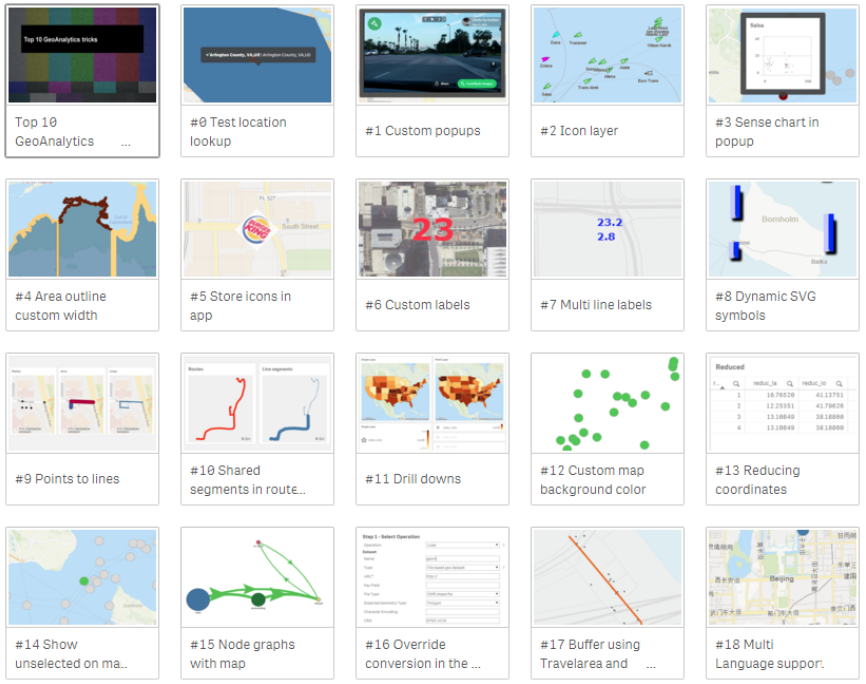
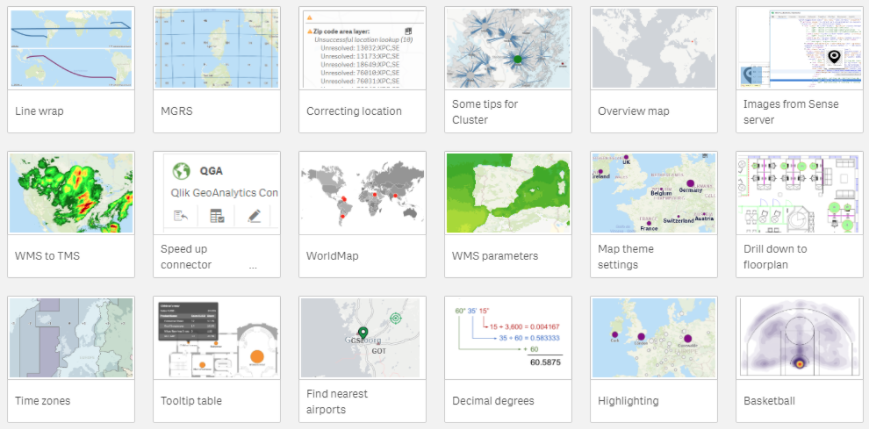
- and more options for using geo-spatial representation in Qlik™ can be found in the multiple examples below (TopGeo *)
- use of specific maps and diagrams (indoor maps, but also schematic representations)
(more coming soon)
- quasi-real-time monitoring of phenomena and alerts with geographical positioning or on specific diagrams
(more coming soon)
For information about Qlik™, visit this page: qlik.com.
If you are interested in QQgeomarketing™ product, or you need more information, please fill in the form here !
In order to be in touch with the latest news in the field, uniques solutions explained, but also with our personal perspectives regarding the world of management, data and analytics, we recommend the QQblog !

