QQvalidator™

You don't have a solution for continuously evaluating the quality of the data in the extracted reports !? QQvalidator™, could be the answer to this challenge!
The short content of the entire post can be found here

Introduction

Most international studies that investigated management’s confidence in the correctness of the data delivered by company reports showed (surprisingly for us) that in over 60% of respondents the level of mistrust was extremely high.

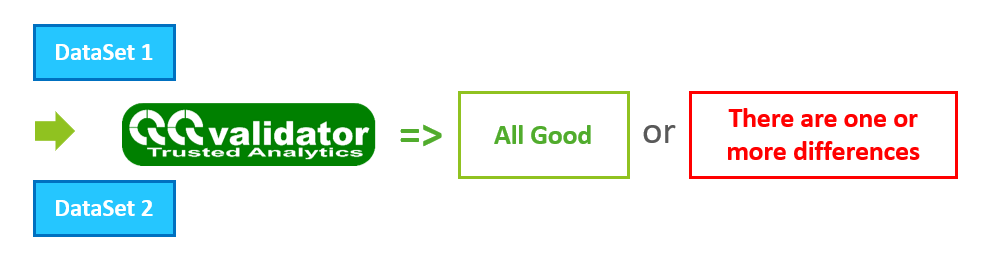
So, we picked up the gauntlet and recently developed a Qlik™ tool, called QQvalidator™, which helps us do validations between a control dataset (XLS file, or CSV, or QVD, or SQL table, etc.). and data read and processed by us.

Validation takes place systematically and completely, in the same way, whenever there are changes in the data processing logic, based on validation settings and validation control data sets.

We can add new validation requirements at any time and monitor this even if we haven’t broken the latter when we’ve added additional processing.

By default, we perform continuous validations on each data refresh, (simultaneously confirming that no previous historical data has changed or how the current processing interprets them).

We practically took over the DevOps concepts related to Continuous Testing and brought them to the Data Engineering / Data Integration / Business Intelligence space.

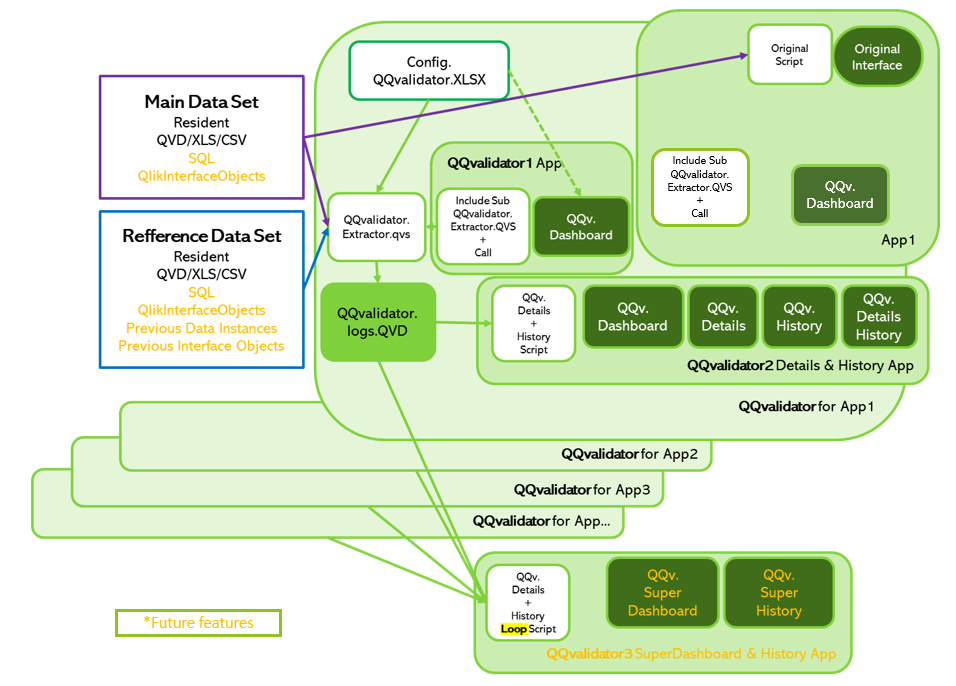
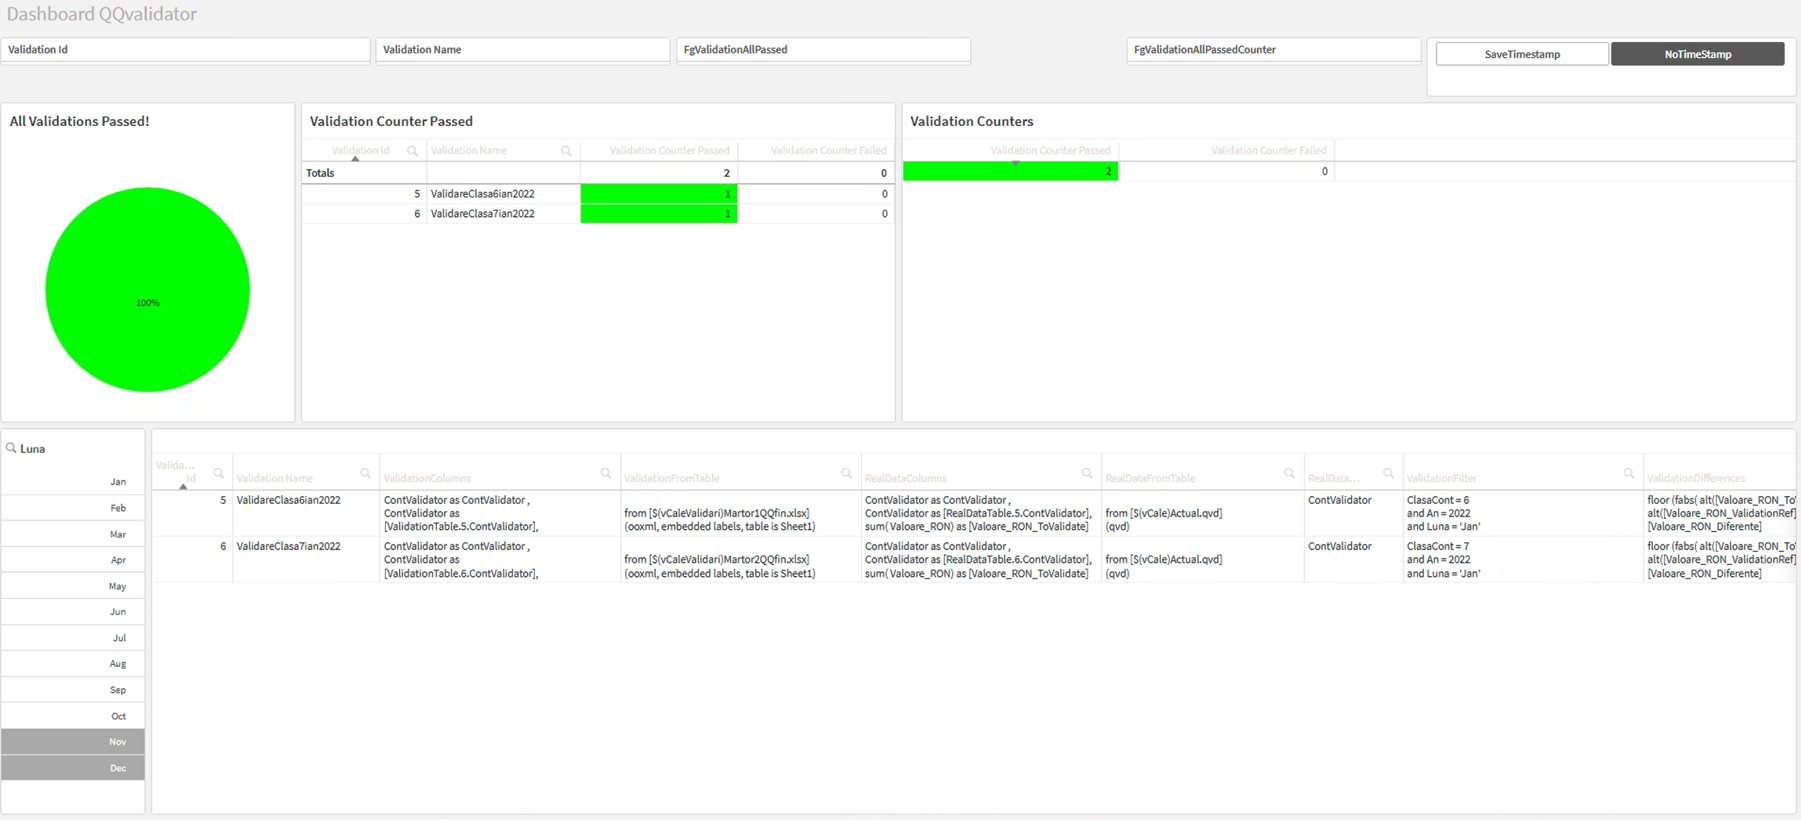
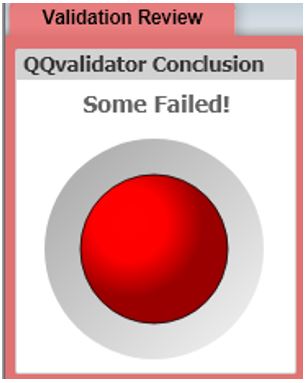
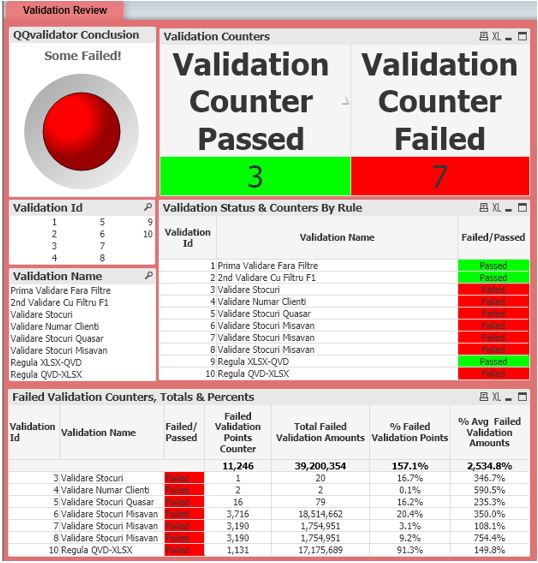
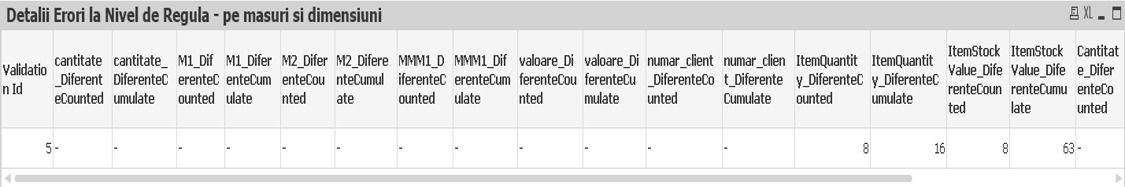
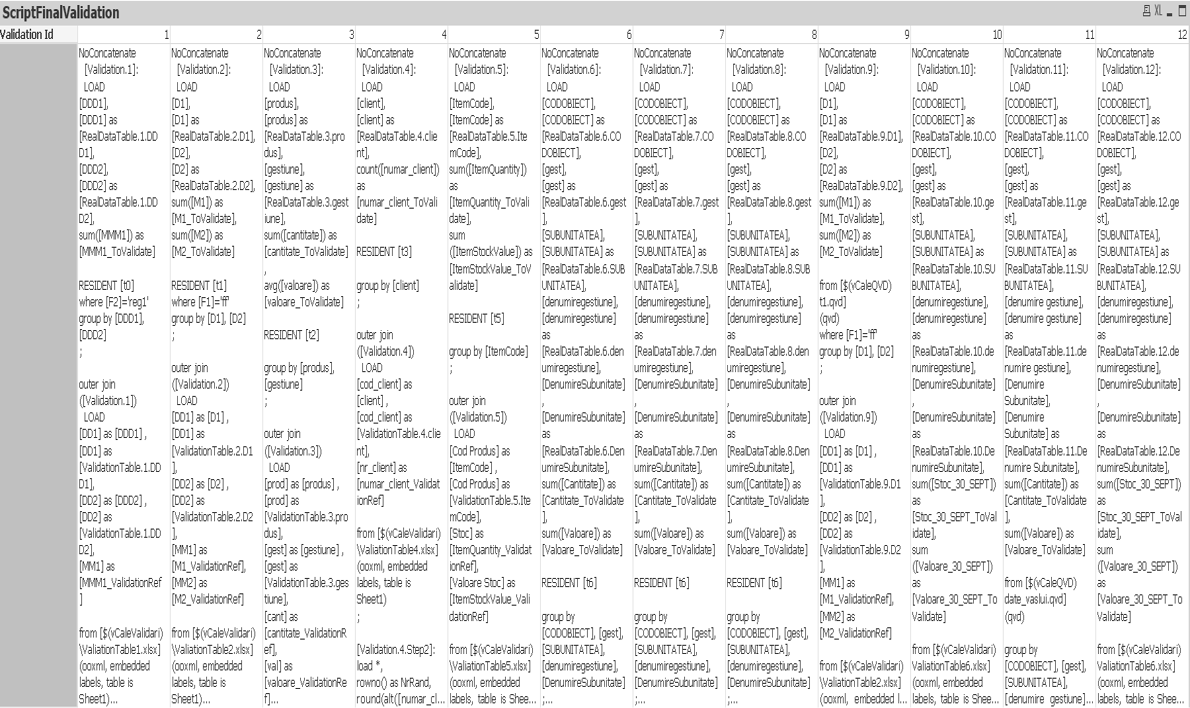
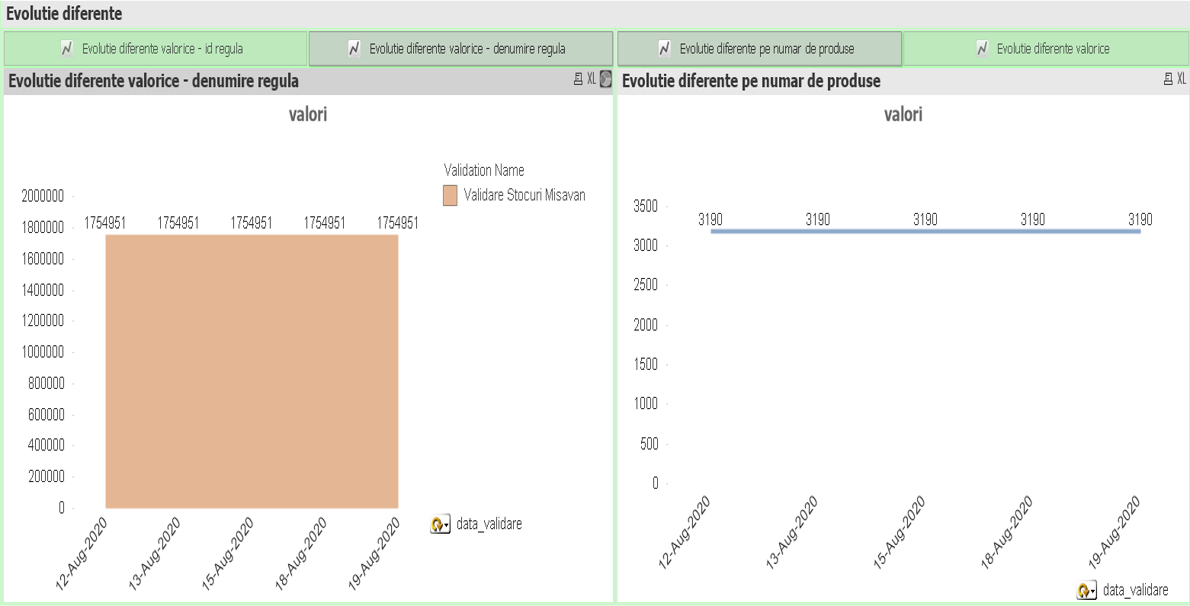
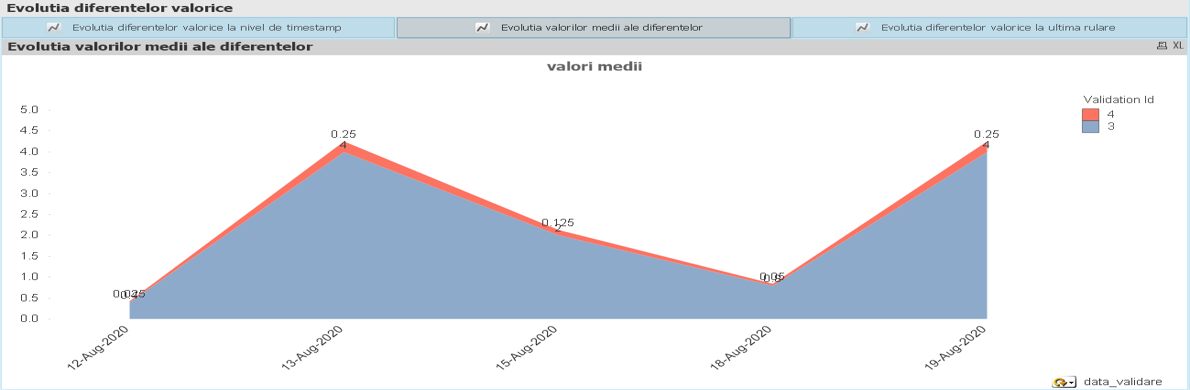
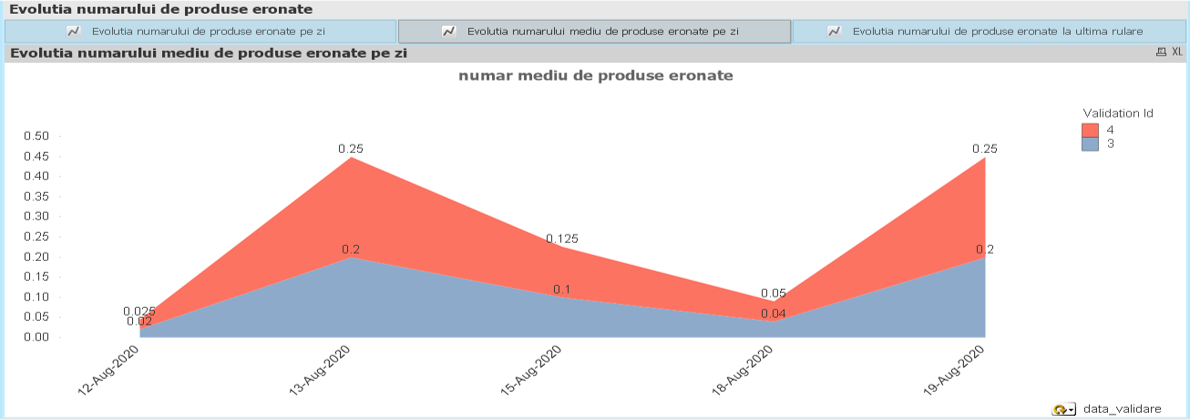
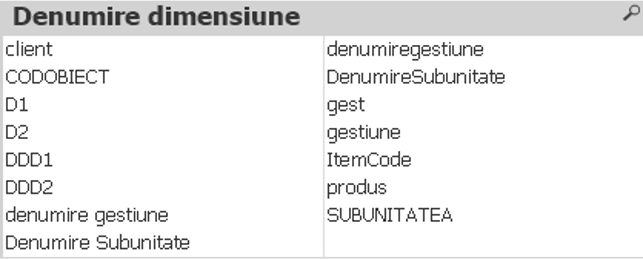
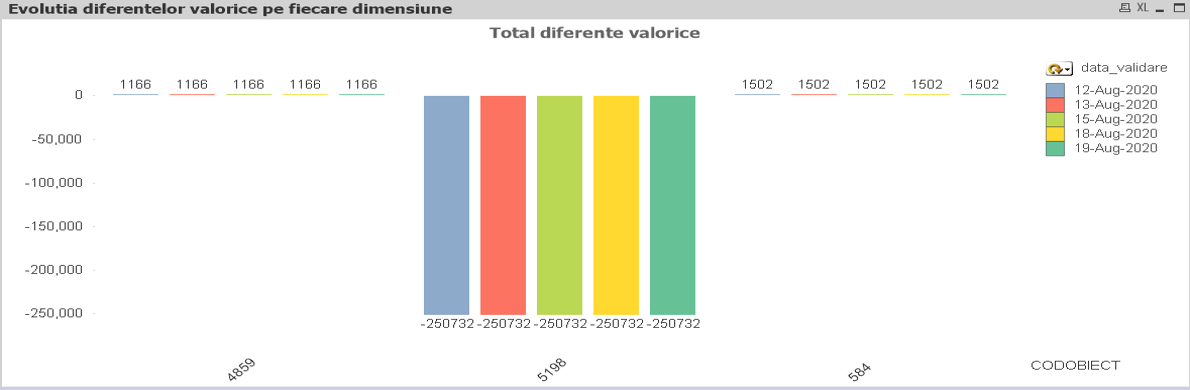
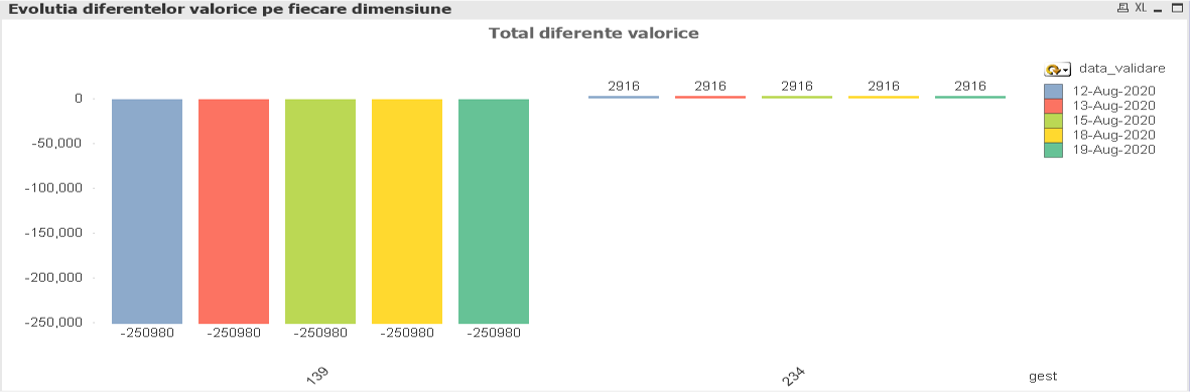
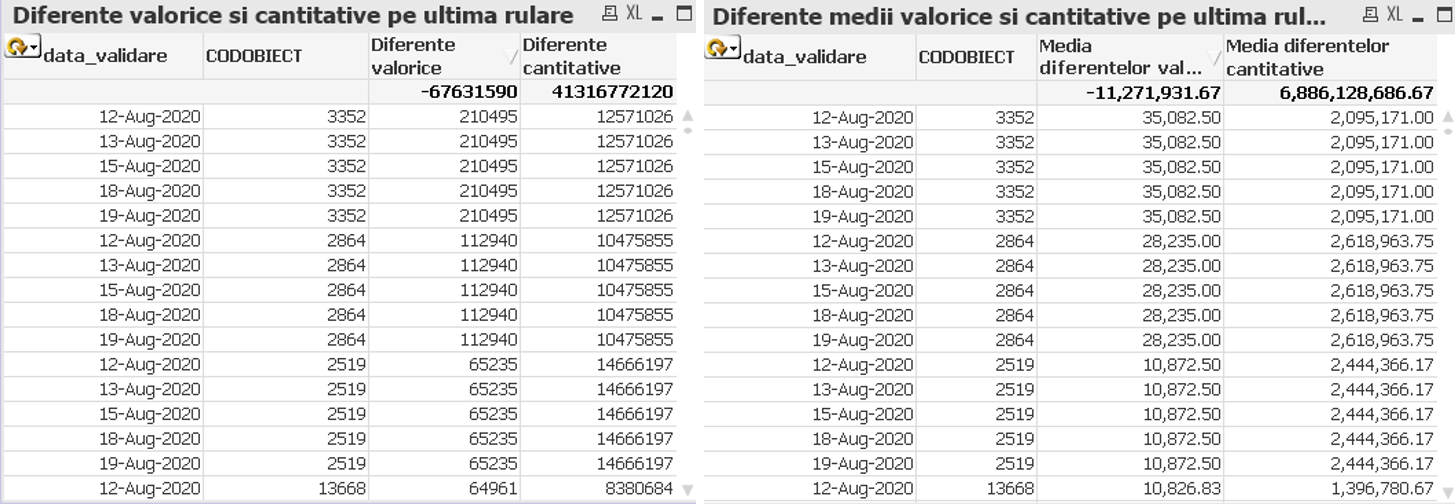
QQvalidator™ allows you to define a set of static (or dynamic) reference data sets that will be the basis for checking for data currently loaded from data sources into the business intelligence platform, tracking whether differences occur or not during last reload. Once differences are identified, the system allows you to dig further into the details (which rule did not pass, how many and which data points have differences, how relevant the difference is, when, in which application/ server/ environment…).

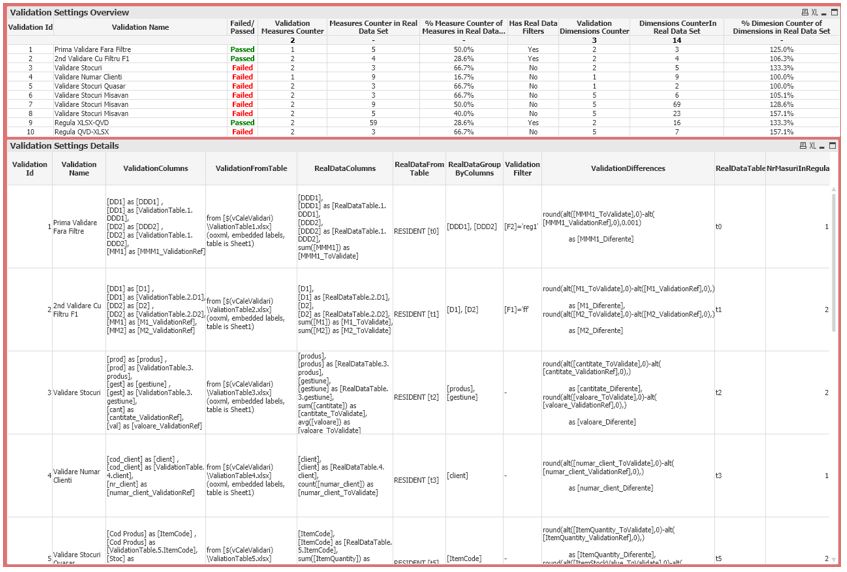
Several validation rules are possible, using, each of them, different data sources for the reference data and different tables to be checked, providing dedicated settings for filtering, aggregating, and aligning the data for each validation rule. Multiple validation measures can be defined simultaneously within the same rule, while providing more efficient recharge times and higher reliability.

QQvalidator™ can be used for continuous testing (in agile environments), both in Qlik Sense™ and in QlikView™.

There are at least 5 benefits to using QQvalidator™:

  •  the validation time is shortened (and implicitly the internal time budget and the external cost budget!);
  • significantly increases the volume of data on which validation can be done and the number of validation points;
  • all validations are performed systematically, in the same order and completely, each time;
  • there is the complete traceability of the validation processes and of the results obtained at each revalidation instance;
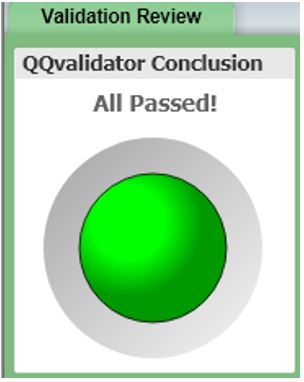
  • the general and detailed state of validation is consistently visible at the top management level, eliminating the risk of using erroneous analyzes in decision making.

QQvalidator™ Objectives

  • QQvalidator™ aims to monitor 2 data sets and validate compliance with compliance rules between the 2 data sets, individually or in aggregate (usually validates a current data set, compared to a set used as a validation control).
  • It allows the creation of various validation rules, which correspond to the requirements of business users and simultaneously with those of the technical team (business intelligence).
  • The results provided by QQvalidator™ show the differences recorded between the data contained in the 2 data sources included in each validation rule, after the application of the validation rules. The presentation is made both numerically (how many differences we have) and in value (how big are the differences), both in absolute values ​​and in values ​​relative to the local subtotal.
  • QQvalidator™offers not only the processing, but simultaneously the fast and intuitive understanding of the validation rules used in comparison with the 2 data sources related to each validation rule (including at the level of the end user interface of business users).

Use Cases

  • Multiple restores in the development cycle of the Qlik™ application
  • Protect your team of BI developers (& business users) from the risk of data instability
  • The new edition of Qlik™ (with the latest data uploaded) can be compared to an earlier version (now at the data structure level, and soon at the interface level)
  • The Dev Ops BI scenario requires continuous testing
  • Large number of Qlik™ Apps applications need a quick overview of the validation status (see QQvalidator.dashboard)
  • Unique validation monitoring site fora wide range of Qlik™even for a distributed Qlik™ environment, multi-server and multi-tenant and multi-location, including a mixed QlikView™ and Qlik Sense™ environment… (all extensible and when validating data from non-Qlik™ environments, to which we can connect with Qlik Sense™ or QlikView™)

Benefits of Use

  • The validation package is quick & easy to implement (in less than 5 minutes)
  • Set up a new validation rule in less than 1 minute
  • Validations are defined once & reused continuously
  • Validation rules easy to reuse in similar environments
  • Easy to understand PASS / FAIL
    One big “red light” in case of at least one validation failure
  • Effective aggregation formulas for counting and evaluating the impact of errors
  • Comprehensive multi-level understanding of the causes of validation failures (including past information)
  • End-to-end validation (up to the results in the interface!)
  • Dynamic validation possible (regression analytics)*
  • Validation of the quality of the data processing process (age/ freshness of the data) is included*
  • Validarea poate fi aplicată la orice nivel de procesare a datelor:
    • raw data
    • data in intermediate processing status
    • final scheme
    • final interface (including simultaneously at all levels in the same environment!)

Simple 3-step validation setup

  1. Define each rule + the 2 data sets to be compared
  2. Define filtering (if any) for both:
    • the data set we want to validate
    • the reference data set
  3. Define the columns of the 2 sets (multiple sizes and several measures can be defined within the same validation rule), ie:
    • dimension alignment (including data change)
    • columns with measures to be compared (including aggregation function and type of comparison)

QQvalidator™ Simple Diagram

QQvalidator™ Structure

QQvalidator™ is Easy to Implement

QQvalidator™ Components

Interface Elements and Applications

QQvalidator.dashboard™
versus
QQvalidator.details™
versus
QQvalidator.history™
versus
QQvalidator.detailsHistory™

  • The QQvalidator.dashboard™
  • page is just the beginning, it offers a “bird eye” view
    (for the last reload data set)
  • The QQvalidator.dashboard™ is present in both applications:
    • QQvalidator™ 1 application
    • QQvalidator™ 2 application
      (and can also be integrated into Qlik™ application which it monitors)
  • QQvalidator™ 2 application also offers:
    • detailed information on the latest validations at the point of validation point level (QQvalidator.details™ page)
    • information from the history of previously performed high-level validations (QQvalidator.history™ page)
    • detailed information from the history of previously performed high-level validations (QQvalidator.detailsHistory™ page)

QQvalidator™ Dashboard in Qlik Sense™

QQvalidator™ Applications

QQvalidator™ 1 Application

  • QQvalidator™ 1 application contains the main script for executing the validation process according to the defined validation rules. The same process saves QQvalidator.QVD files for further exploration in detail and history or in the QQvalidator™ 3 application (Super Dashboard).
  • The QQvalidator™ 1 application contains the QQvalidator.dashboard™page, which provides a “bird eye” view only for the last validation (for the last set of reloaded data).
  • The content of the QQvalidator™ 1 application can be transferred in less than 1 minute to a real-life Qlik™ application for a deeper integration of the validation processes with the main ETL processes.
QQvalidator.dashboard™ for Quick Confirmations

The Dashboard page contains, first, a large surface object, which offers the final verdict: validation with or without success?
The page has the background Color correlated with the same color convention for quick visual alert.

QlikView™ also allows you to color the page tab, so that the general validation status can be found even without inspecting the dashboard page.

   Green => All good
at current reload

Red   => Minimum 1 failure
at current reload


The general picture of the validation results is easy to understand, in total, but also for each validation rule separately, being immediately available:

  • Number of successful and unsuccessful validation rules
  • Validation status of each rule
  • Number of validation points with problems at each rule and in total
  • Percentage of problem points on each rule and on the total
  • Percentage difference from the reference value
Meta Information about Validation Rules

Additional meta information on validation rules is also provided on an adjacent page, to allow an understanding of the validation context of each rule.

QQvalidator™ 2

The first page of the QQvalidator 2 application contains the dashboard that provides a visual representation of the validations performed, while the following are divided between QQvalidator.details, QQvalidator.history, QQvalidator.detailsHistory, which include a more detailed analysis of the results which we view on theQQvalidator.dashboardpage, as well as their history.

These analytics are especially recommended in the case of rules that have registered errors.

QQvalidator.Details™

In this page, we can notice in detail each rule that has been subjected to the validation process.

However, the emphasis is on the rules whose validation process ended in failure, as we can analyze each rule at the level of size and measurement, to observe the fields in which there are differences between the data from the control tables and tables of real facts.

Within the Validation Script by Rule page we see the final script associated with each rule.

QQvalidator.History™

In the following pages, we already analyze the results, referring to the history of validations.

Evolutions of the value and quantitative differences, of the number of erroneous products, of the average values ​​every day or, in more detail, at the timestamp level for each rule are analyzed, having the possibility to analyze these values ​​also at the time of the last run from that day.

We can also extend the analysis to each dimension level in the tables.

Within the Evolution of Value and Quantitative Differences page we have a container that includes graphs regarding the value differences and the number of erroneous products at the level of id and rule name, every day or at the time of each run.

At the level of the Evolutions on Data and Timestamp page, we find the average value differences and the average number of erroneous products, at the date, timestamp level, but also at the time of the last run of that day.

QQvalidator.Details.History™

In the following pages, the Evolution of Value and Quantitative Differences on Each Dimension and Average Values ​​by Dimensions, the analytics performed are the same, ie evolutions of the differences recorded in terms of value and quantity, as well as their averages, only now it is no longer usually, respectively id rule, but it is at the level of size, the differences being recorded, for example, for each product, subunit, management, etc.

For example, here we have the value evolution of the differences for different object codes, respectively managements.

Also, to easily view the values ​​obtained, we made a table for each page, based on the formulas we used in the graphs.

QQvalidator™ 3

The QQvalidator™ 3 application comes with an even greater integration capability, unifying the simultaneous monitoring of several applications, sites, beneficiaries, etc.

The main interface components are:

  • Configuration Space (A list of folders to be scanned by LogsValidator*.QVD + additional QQvalidator 3 meta dimensions)
  • Script
    • Loop QVD files generated by the individual validation processes of multiple Qlik Sense™ or QlikView™ applications
  • Interface
    • Current Dashboard page
    • Current Details page*
    • Histoical page*
    • Historical Details page*
      depending on the volume of data and hardware resources available, you can choose whether to activate these components that become relevant only in certain contexts

Conclusions

QQvalidator™ brings extreme added value through a Dev Ops specific continuous testing approach, in multiple usage scenarios, offering simultaneously:

    • business users of Qlik™ analytics
      • safety in the consistency of processing by continuous validation
      • including transparency in validation methodology and status
    • business intelligence teams (internalized or outsourced)
      • easy to install and maintain solution for validating Qlik™ processing (and not only)
      • applicable in various scenarios
      • fast and scalable monitoring

QQvalidator™ is the work of the most important components of the concepts gathered in QQtrust.
If you are interested in QQvalidator™product, please fill in the form here.

For other QQinfo solutions, please access this page: QQsolutions.

For information about Qlik™, please visit this site: qlik.com

To be in touch with the latest news in the field, unique solutions explained, but also with our personal perspectives in terms of the world of management, data, and analytics, we recommend the QQblog !