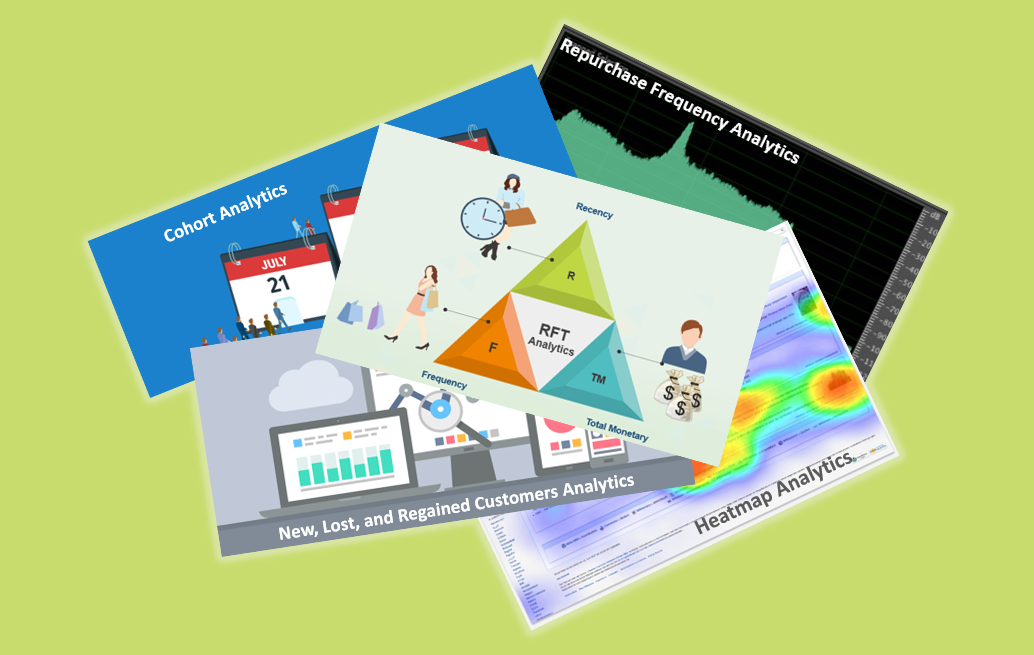
Beyond the already usual analyzes, listed in the QQsales.margin™ package, the advanced analysis capabilities and performance, but also the levels of detail available in more and more sales monitoring systems have brought us in a position to add to our analysis portfolio, ready prepared, an extensive set of analyzes, from the categories
- cohorts analytics
- RFT analytics (Recency-Frequency-Total)
- pivoting heatmap analytics during the first order of the customer and the product
- analysis of new, lost, and regained customers
- correlated analysis of repurchase frequency
Below, there are some examples of the analytics specified above.
- Cohorts Analytics
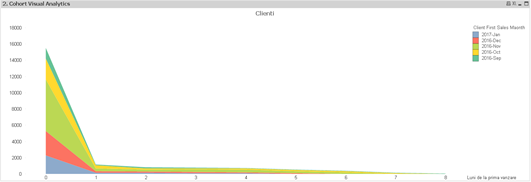
It allows the rapid evaluation of the evolution over time of the quality of the newly acquired customers.
(Newly purchased customers are grouped into cohorts/ generations of new customers. In our case, a generation is defined by the year-month of the first purchase).
Each customer is identified by the first month of sale and from there, for each subsequent sale, in how many months of sale from the first sale that sale was.
The less smooth the curve, the more loyal customers we have in the long run (desirable situation).
If there are subsequent highs, repurchase frequencies can be identified.
- RFT Analysis (Recency-Frequency-Total)
For companies that can identify their customers in the sales history, RFT analysis allows the identification of the structure (especially long-term) of the customer portfolio in terms of frequency of purchase, total number of business interactions (sales) and freshness of the relationship (recency).
The analysis is usually a long-term analysis and can be the starting point for a major improvement in customer segmentation and hence a better development of the market approach strategy (go-to-market strategy).
- Pivoting heatmap analysis during the first order of the customer and the product
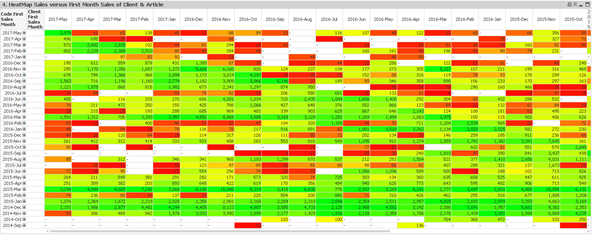
Allows visual identification of the impact on sales, the link between the customer’s debut month and the product. (The analysis measure can be chosen from the sales-specific measures).
- Number of Orders
- Sale Quantity
- Sale Value
- Margin Value for Sale
The analysis can be detailed by filtering on all dimensions specific to sales facts:
- products and their classifications,
- promotion and sales entities,
- date of sale and other time dimensions.
The values assigned to the middle thresholds are highlighted in shades of yellow, while the values above these values are highlighted in intense reddish and magenta shades, and the values below the middle thresholds of the products are colored in more discreet shades of green blue, the smaller they are.
There are mostly intensely colored horizontal lines colored in magenta, which highlight certain periods of onset of products with a high incidence on sale so far.
OBS: We recommend excluding shipping or discount items from the analysis.
The analysis can be extended to the start date of other dimensions of sales, including cities, regions, product categories, suppliers, etc.
- Analysis of new, lost, and regained customers
It allows the identification of the number of new customers lately (Month / Quarter / Year), but also of those who have lost recently, as well as the impact on sales of these new and lost customers. The definition of new customer or lost customer can be reformulated according to specific business needs.
The analysis can be done on other dimensions, including product, cities, regions, etc.
- Correlated analysis of repurchase frequency
These additional sets of analysis can highlight subtle buying habits and/ or associations that can be turned into good practices and ways to improve business.
For information about Qlik™, visit this page: qlik.com.
If you are interested in QQsales.advanced™ product, or you need more information, please fill in the form here !
In order to be in touch with the latest news in the field, uniques solutions explained, but also with our personal perspectives regarding the world of management, data and analytics, we recommend the QQblog !
