QQsales.margin™

Interactive Sales and Commercial Margin Analysis

Whether we are talking about a QlikView™, Qlik Sense™ or Qlik Sense SaaS™ (Cloud) implementation, we offer you an interactive visual analysis package that covers the main basic needs of a company in which sales and commercial margin management is essential for success (especially, but not only in the area of ​​distribution & retail). Let’s not forget that, originally, the concept of Business Intelligence was developed to serve large retail, distribution and banking companies).

Contents QQsales.margin™ Detail

1. Dashboard Page

The dashboard is allowing you to view essential company data.
Qlik™‘s dashboards can be compared in terms of functionality to the dashboard of an aircraft or car.

Both provide essential data for reaching the destination in optimal conditions of safety and efficiency.

Below you can see possible viewing options for a Dashboard and its usual capabilities.

KPI (Key Performance Indicator) presentations allow the visualization of some essential numbers, generally of the absolute value type, possibly with the visualization of the reference values ​​and with the signaling of the meaning and the positive or negative position of the variation towards the reference/ references.

KPI Declination in  QlikView™ Dashboard

KPI Declination in Qlik Sense™ Dashboard

Gauge presentations (on-board indicator) allow the visualization of essential numbers, generally of the execution percentage type (usually compared to a previous period or to a budgeted/ planned target).

Gauge Declination in
QlikView™ Dashboard

Gauge Declination in
Qlik Sense™ Dashboard

2. Timeline Page

LINE GRAPH (TIMELINE) – is a graphical view of the variation of one or more parameters over time. 
Qlik™ allows several types of analyzes of these line charts, including comparative analyzes of developments.

It is also possible to offer evolutions of several indicators in time in parallel, presented in adjacent objects, but more advanced time-line mechanisms can be built.

Below are the usual Timeline view variants included in QQsales.

Simple TimeLine

The classic Timeline chart allows the identification of the variation of a numerical indicator (measure) according to a specific time dimension, which continuously covers a time horizon.

Simple Timeline Declination in 
QlikView™
Dashboard

Simple Timeline Declination in
Qlik Sense™ Dashboard

Area Chart

Starting from the first graph presented, we usually derive a graph that highlights the evolution of the time distribution of an indicator, according to an important non-temporal dimension. The temporal, non-temporal dimension, but also the visualized measure can be quickly changed by the user, using the circular options (in QlikView™) and the alternative ones (in Qlik Sense™).

We recommend avoiding non-temporal dimensions with too many entities, in order to be able to highlight this information in an intelligible way.

Area Chart Declination în  QlikView™ Dashboard

Area Chart Declination in Qlik Sense™ Dashboard

Seasonal Time Chart  

The Timeline Chart underlines seasonality and allows the identification of the variation of a numerical indicator (measure) according to a specific temporal dimension, overlapped on several years.

Seasonal Time Chart Declination in
QlikView™
Dashboard

Seasonal Time Chart Declination in
Qlik Sense™
Dashboard

3. Ranking Page (Top Page)

Descending Top Horizontal Bars

Wrong text coming from next paragraph ! An important element related to the added value delivered by QQinfo (and supported by the Qlik™ platform), when implementing BI systems is the construction of a dynamic interface, with objects that change their content in the context of user choices. With this approach, a single object can contain, simultaneously, tens, or hundreds, or even thousands of visualization variants for which the development time and cost in the interface could become huge.

Descending Top Horizontal Bars Declination in
QlikView™ Dashboard

Descending Top Horizontal Bars
Declination in
Qlik Sense™ Dashboard

Dynamic Charts

An important element related to the added value delivered by QQinfo (and supported by the Qlik™ platform), when implementing BI systems is the construction of a dynamic interface, with objects that change their content in the context of user choices. With this approach, a single object can contain, simultaneously, tens, or hundreds, or even thousands of visualization variants for which the development time and cost in the interface could become huge.

Dynamic Charts Declination in
QlikView™
Dashboard

Dynamic Charts declination in
Qlik Sense™ Dashboard

Tables

Even if we are supporters of prioritizing the graphic visualization first, the pivot or straight table representations can bring a high density of presentation….

Straight tables are usually used in analyzes with many measurement columns and 1 dimensional column. They usually also have a summary row (placed at the beginning or end of the table), on the columns with measures. Sorting is immediate, just 1 click (or 2) on the table header of the column will define the main sorting criteria.

Straight Tables Declination in
QlikView™
Dashboard

Straight Tables Declination in
Qlik Sense™ Dashboard

Pivot tables allow advanced data structuring and hierarchical views, including subtotals and collapse/ expand options. The pivot also allows the placement of columns with horizontal dimensions, for a matrix view.

Pivot Tables Declination in QlikView™ Dashboard

Pivot Tables Declinaton in Qlik Sense™ Dashboard

Tables with mini-graphics included

All studies of the use of managerial analysis interfaces have shown that graphical visualization is more efficient than a tabular representation in highlighting the essential factors of a business.

The explanation: the human mind contains a much more advanced image processor than its digital processor, which is applied in a more abstract plane.

For situations where graphic objects cannot contain enough detail, we recommend using mixed objects, in which tables integrate graphic content into table cells. Graphic representations, including MiniCharts and Whiskers, provide information at a digestible level that is still visually consistent, even if the numerical details are no longer visible at such a density.

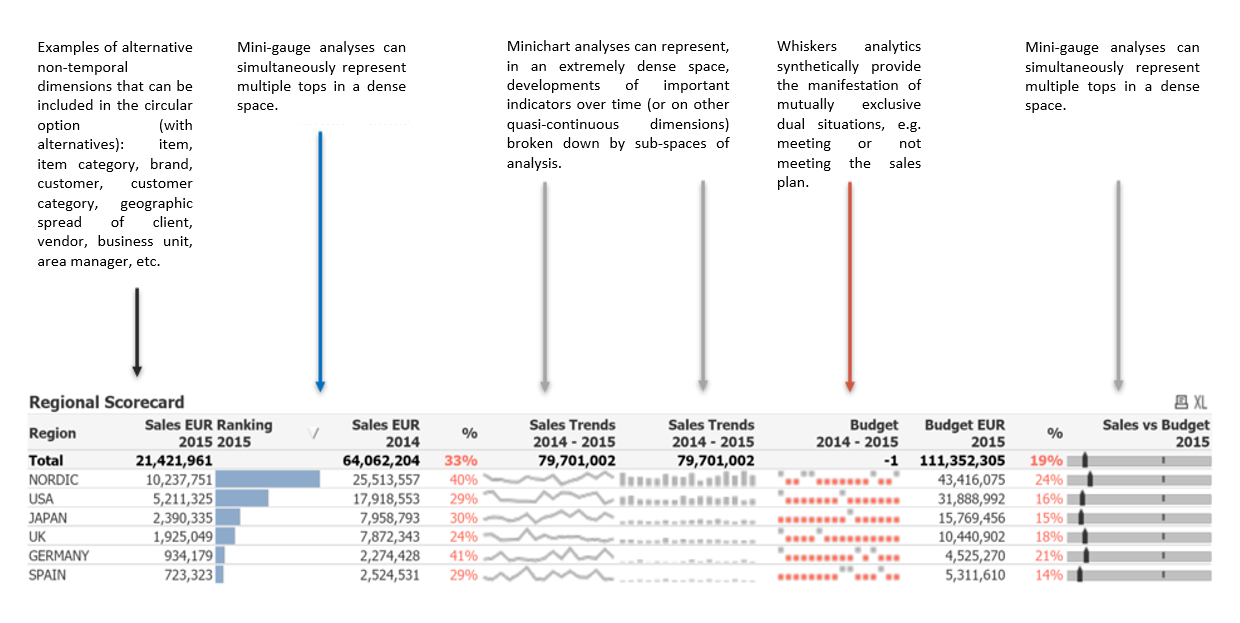
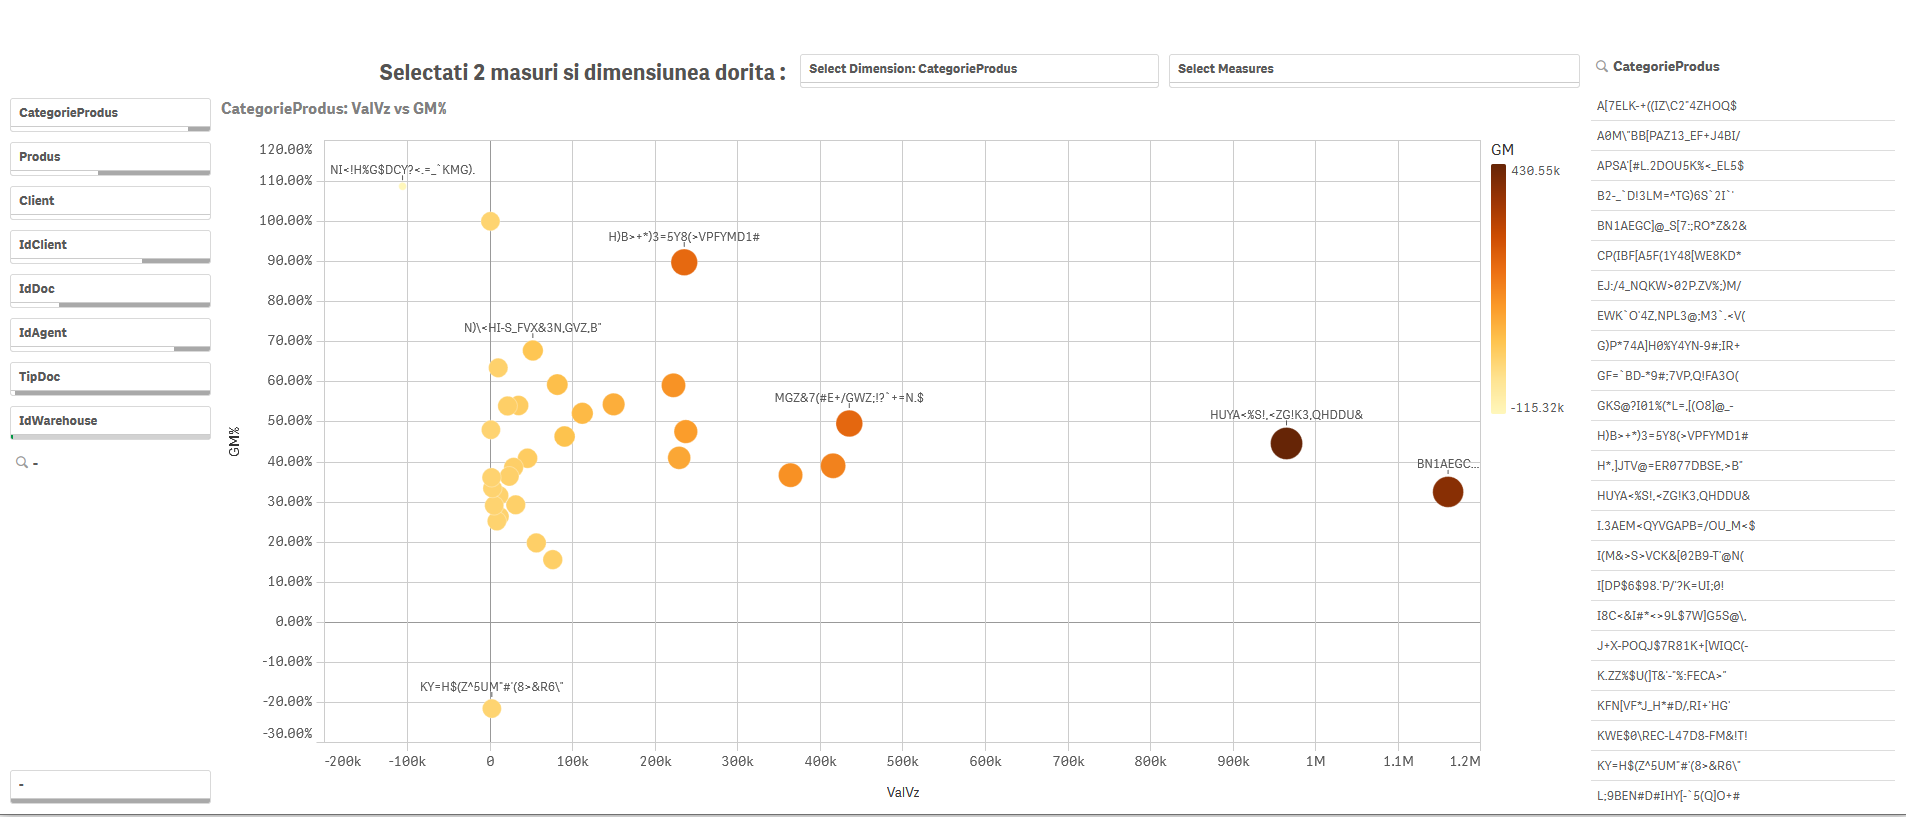
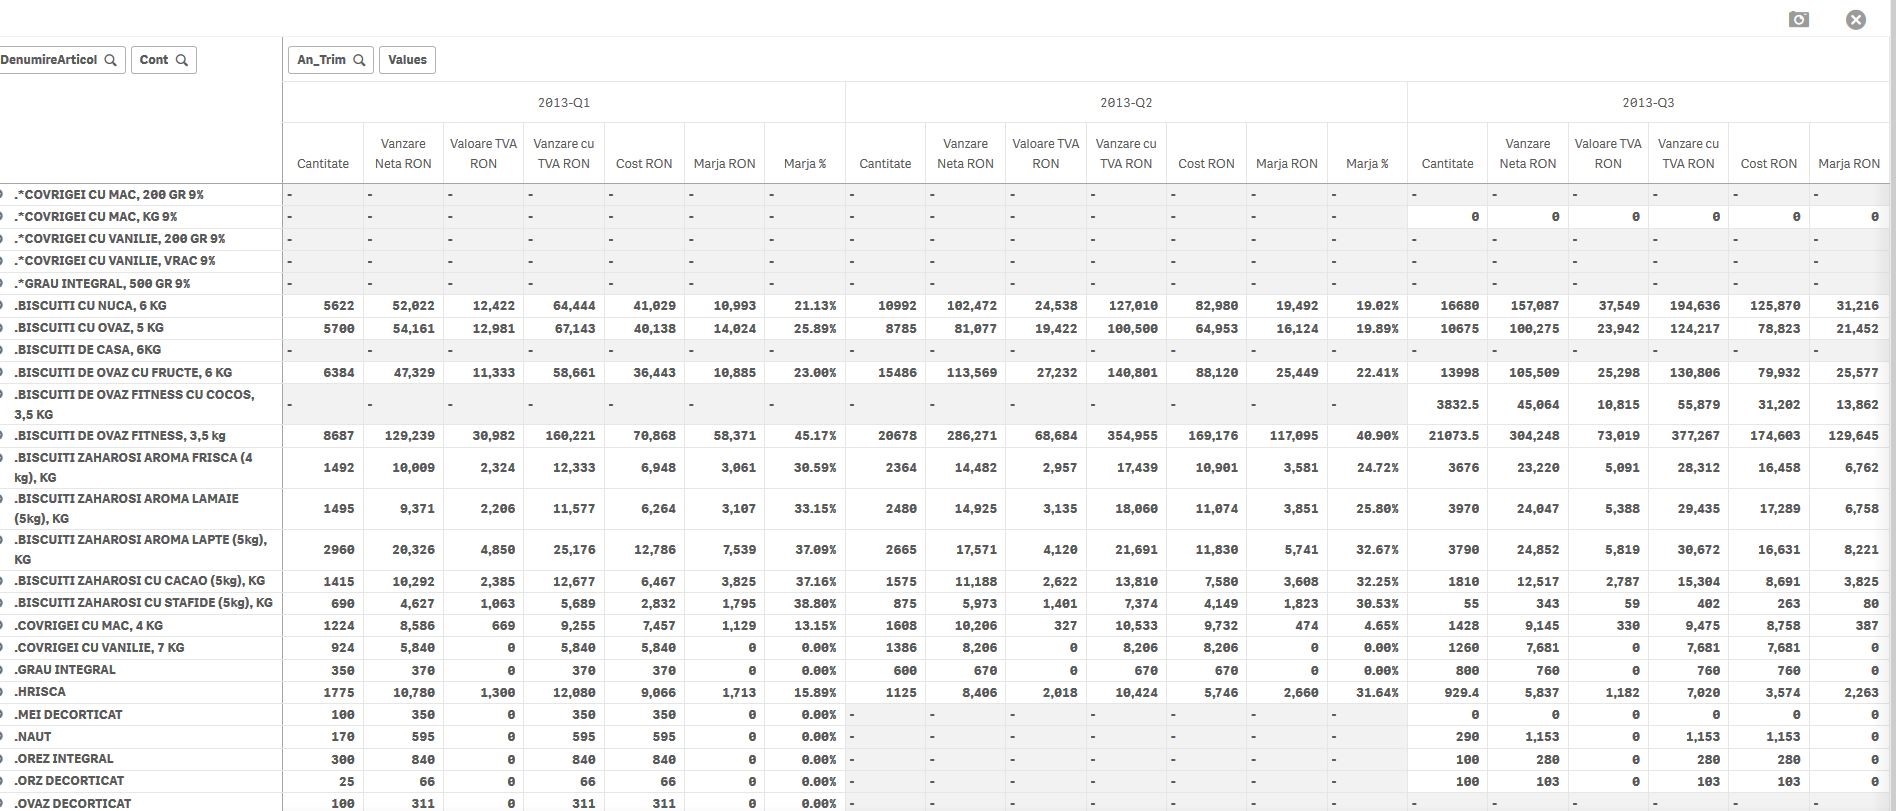
Dynamic objects allow a larger number of analyzes to be encapsulated in a single object. With this approach, a single object can contain, simultaneously, tens, or hundreds, or even thousands of visualization variants for which the development time and cost in the interface could become huge.

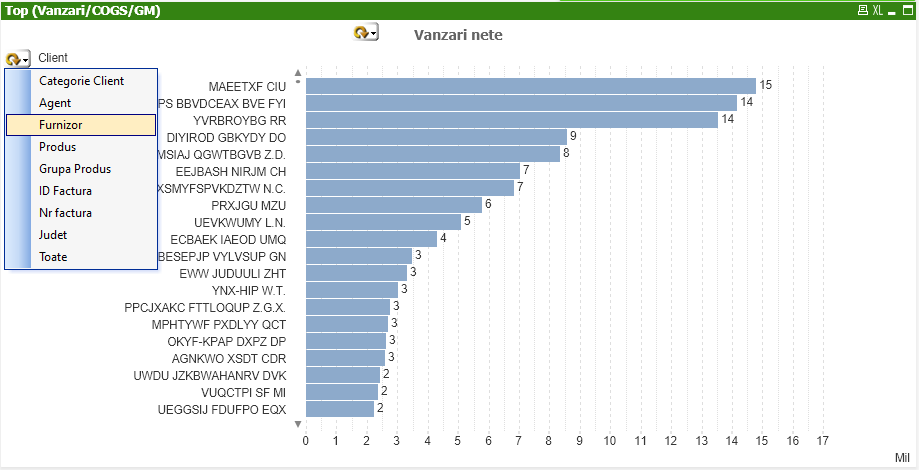
For example, even for a very simple Bar Chart object with Descending Tops, if it is defined to offer, at the user’s choice, directly in the interface, at the time of consuming the analysis,

any relevant non-temporal dimension (usually there are at least 5-6 such dimensions in less sophisticated companies, but it can reach 20 or more, in the case of companies with high complexity,
any relevant measure in the context (usually again you can quickly overcome a number of 4-5 measures, but even here you can reach an impressive number, of the order of dozens of variants, relatively quickly),
if we talk about value analyzes, measured in money, often the analyzes are done in several currencies, at least in RON and EUR, again at the user’s choice, directly in the interface.

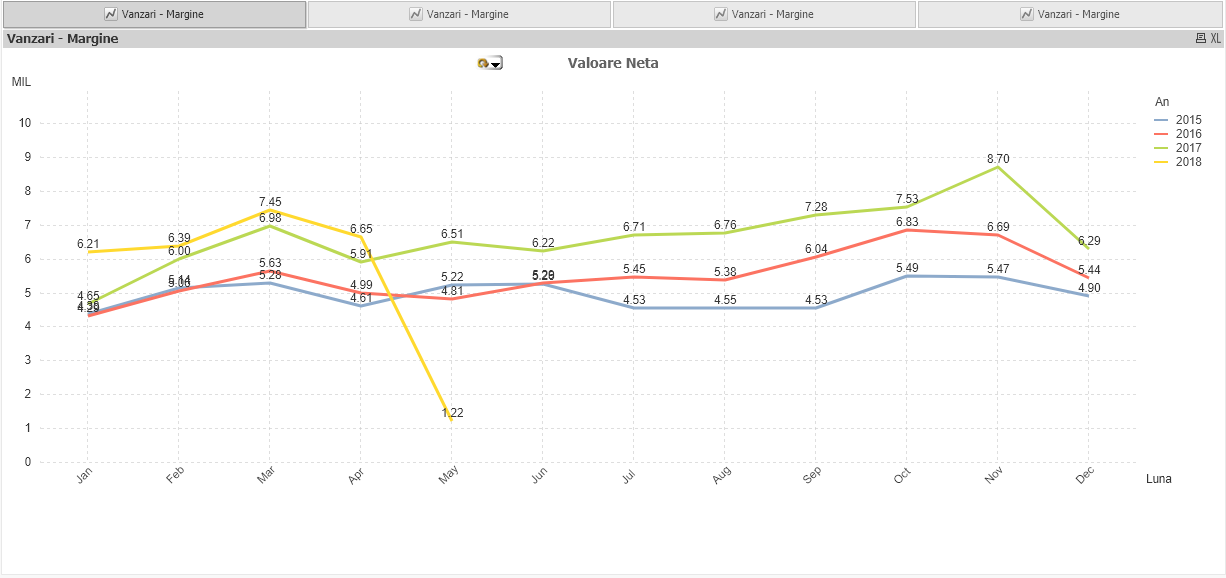
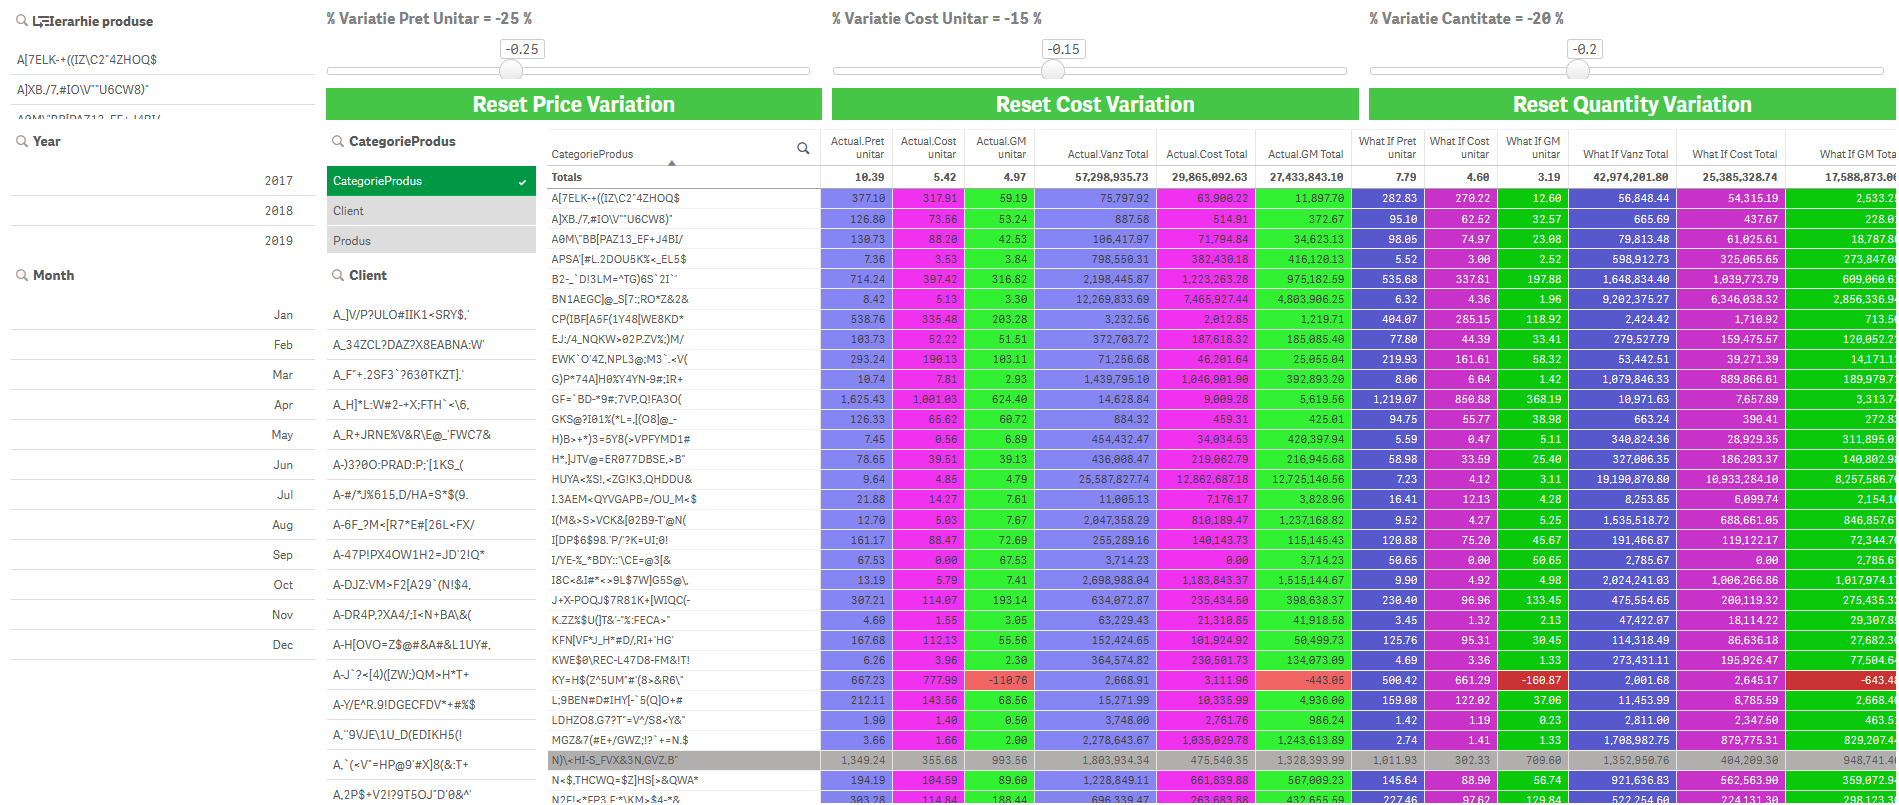
Putting these variants together, even in minimal variants, we obtain in a single object a set of options of 5 measures x 2 coins x 5 dimensions = 50 different variants of analysis. (And this without considering any filtering option on a subset of data in the report generation).

Tables with Mini-graphics Declination in QlikView™ Dashboard

Tables with Mini-graphics Declination in  Qlik Sense™ Dashboard

4. What-If Page

It is an important tool in substantiating tricky decisions.

What-If analyzes quickly generate an unlimited number of scenarios, which are based on custom variables used to define any “what if…” question.

These analytics  allow you to quickly identify and visually understand the optimal solution, with minimal loss, or to identify the solution with maximum profitability potential.

In the example below, the included variation parameters (in the left area) can be changed immediately by cursors (and buttons):

  • unit selling price
  • unit cost of sale
  • sold quantity 

The impact on all relevant indicators within the context can be analyzed immediately, including the resulting final calculation (lower right corner) of percentage margin loss or gain.

What-If Declination in QlikView™ Dashboard

What-If Declination in Qlik Sense™ Dashboard

We added 2 scenarios over the same set of departure dates.

Although it seems slightly counterintuitive, there are quite a few situations in which, rather than to make a significant discount to increase the quantity sold, it is more profitable (in terms of net value commercial margin) to sell with a higher addition and in a slightly smaller quantity.

In the second case presented, although it seems in the mirror with the first, the difference in profitability is dramatic, leading to higher total costs than revenues and a negative net margin, not just a decrease in margin

This analytics can be performed both globally, for the entire data set, or dedicated for any relevant selection in context. There is also the option to see the impact individually, at the level of article, product category, manufacturer, etc., as seen below.

What-If Declination in QlikView™ Dashboard

What-If Declination in  Qlik Sense™ Dashboard

5. Scatter Cloud Analytics Page

This kind of analytics are used to visualize the simultaneous spread of a set of 2-3-4 measures in the population of analyzed entities (1 analytical dimension).

Such an analysis can highlight:

  • similar phenomena by observing grouped (clustering) points,
  • or the belonging of the points to certain curves which may suggest possible correlations between the considered measures ,
  • or the lack of population in certain areas that may suggest phenomenological limitations.

One of the most widespread economic representations for scatter cloud is the one in which the sales value is represented on the horizontal axis, and the percentual margin on the vertical one.

With the help of this specific approach, one can quickly identify the performing and the non-performing portfolio on any of the analyzed dimensions (clients, articles, agents, categories and classifications of all, etc.): in the upper right are the golden chickens, which must be given maximum attention and confidentiality, in the lower left are the “losers”, which must be moved to the right and / or up ( otherwise you should better give them up).

Scatter Cloud Analytics Declination in 
QlikView™
Dashboard

Scatter Cloud Analytics Declination in
Qlik Sense™ Dashboard

6. Geographical Visualization (GIS Representation)

Starting from the need to identify the commercially under-exploited geographical areas, on a geographical presentation one can visualize various geo-marketing information:

  • Sales,
  • Sales per thousand inhabitants,
  • No. of customers, or no. of transactions or deliveries.
  •  

Geographical Visualization Declination in
QlikView™ Dashboard

Geographical Visualization Declination in
Qlik Sense™ Dashboard

Additional Declination in Qlik Sense™ Dashboard, using shape
representations associated with dimensional entities
(Romanian counties in this example)

7. View Transaction Details

The detailed representation of the read and/ or processed data may also determine the need to use simple or pivot tables.

Straight (simple) Table Declination in
QlikView™ Dashboard

Pivot Table Declination in
Qlik Sense™ Dashboard

8. Data Quality

Starting from the GIGO principle (Garbage In = Garbage Out … or Gold In = Gold Out), our experience of over 20 years in BI has shown us that this page, which monitors the quality of data read/ processed, is essential. 

Some questions anyone should ask in this area are: 

  • Do we have articles with double codes  ?
  • What about some article codes with doubled naming ? 
  • What about products with multiple clasification on the same hierarchical level ?
  • and many more !

Data Quality Declination in
QlikView™ Dashboard

Data Quality Declination in
Qlik Sense™ Dashboard

9. QQvalidator™

Due to the extremely dynamic nature of the analytics we can’t provide, in order to avoid the risks of error, one of the solutions offered by QQinfo included in this set of analytics is the option to quickly view possible deviations from a set of validation (refference) values that are managed with the QQvalidator™ engine.

Whenever at least one validation rule is violated, the background of the QQvalidator™ dashboard  page turns red, and if the validation process is passed successfully, the page background is marked in green.

QQvalidator™ Declination in
QlikView™
Dashboard

QQvalidator™ Declination in
Qlik Sense™ Dashboard

10. Minimum 3 Auxiliary Pages

To make it easier to navigate between pages, adopting the new platform or access metadata about data and provided analytics, in all QQinfo projects, we add the Intro, How to and Sys (Metadata) pages.

The Intro page brings the general explanations for the application, but also specific details for each page in the interface (a kind of Table of Contents for the application).

Intro Page Declination in
QlikView™ Dashboard

Intro Page Declination in
Qlik Sense™ Dashboard

The How To page contains a small lesson on using Qlik for browsing analytics.

How To Page Declination in
QlikView™ Dashboard

How To Page Declination in
Qlik Sense™ Dashboard

The Sys (Metadata) page provides structured and interactive access to “data about data”. You can quickly identify the tables or columns available in the final data schema of the application and intuitively explore the relationship between them, including all the columns and tables with data behind the application.

This page is most is relevant for those who want to add to (or edit) the interface already built.

Sys Page Declination in
QlikView™ Dashoard

Sys Page Declination in
Qlik Sense™ Dashboard


11. Conclusions

We see this strong pack of analytics  only as a first step (often it is the first set of anlaytics we deliver), but it can be extended with additional views, using the same data, depending on the requirements, business concerns and the specific context of each beneficiary.
For example, for retailers with a large number (> 50-100) of sales entities (stores / vendors), the classic solutions for monitoring the top performers becomes visually overwhelming and the involvement of management by exceptions principle becomes essential, not only  as a management approach, but even in the visual declination of the analytics (more details soon in a dedicated page).

QQsales.margin™ analytical package can also be extended by adding new sources, plus processing and related interface, covering:

  • comparison of sales results with plans,
  • evaluation of the current inventory and inventory history and hence a whole range of rotation analytics (more unique details on how to use this approachcan be found in other QQsolutions packages, such as QQinventory.suite™, QQinventory.prevention, QQinventory.healthcheck, QQrelocation, etc.)
  • evaluation of accounts receivables, especially the outstanding ones (including at the client, product, category or supplier level !). From here, more in depth analytics  can be depicted for cash flow, working capital or CCC (cash cycle conversion)
  • purchase of goods
  • etc.

For QQinfo solutions, visit this page: QQsolutions.

For information about Qlik™, visit this site: qlik.com.

If you are interested in QQsales.margin™ product, please fill in the form here.

In order to be in touch with the latest news in the field, unique solutions explained, but also with our personal perspectives regarding the world of management, data and analytics, we recommend the QQblog !