
When your company has an important part of the capital stocked into inventory (either finished goods or raw materials) and since current economical reality shows a lot of turbulence and instability, it’s natural the need to know if and where inventory management was properly executed. Regardless if we are talking about out of stock, no moving or slow moving situations the impact these situation have in the final profitability of a company is major.
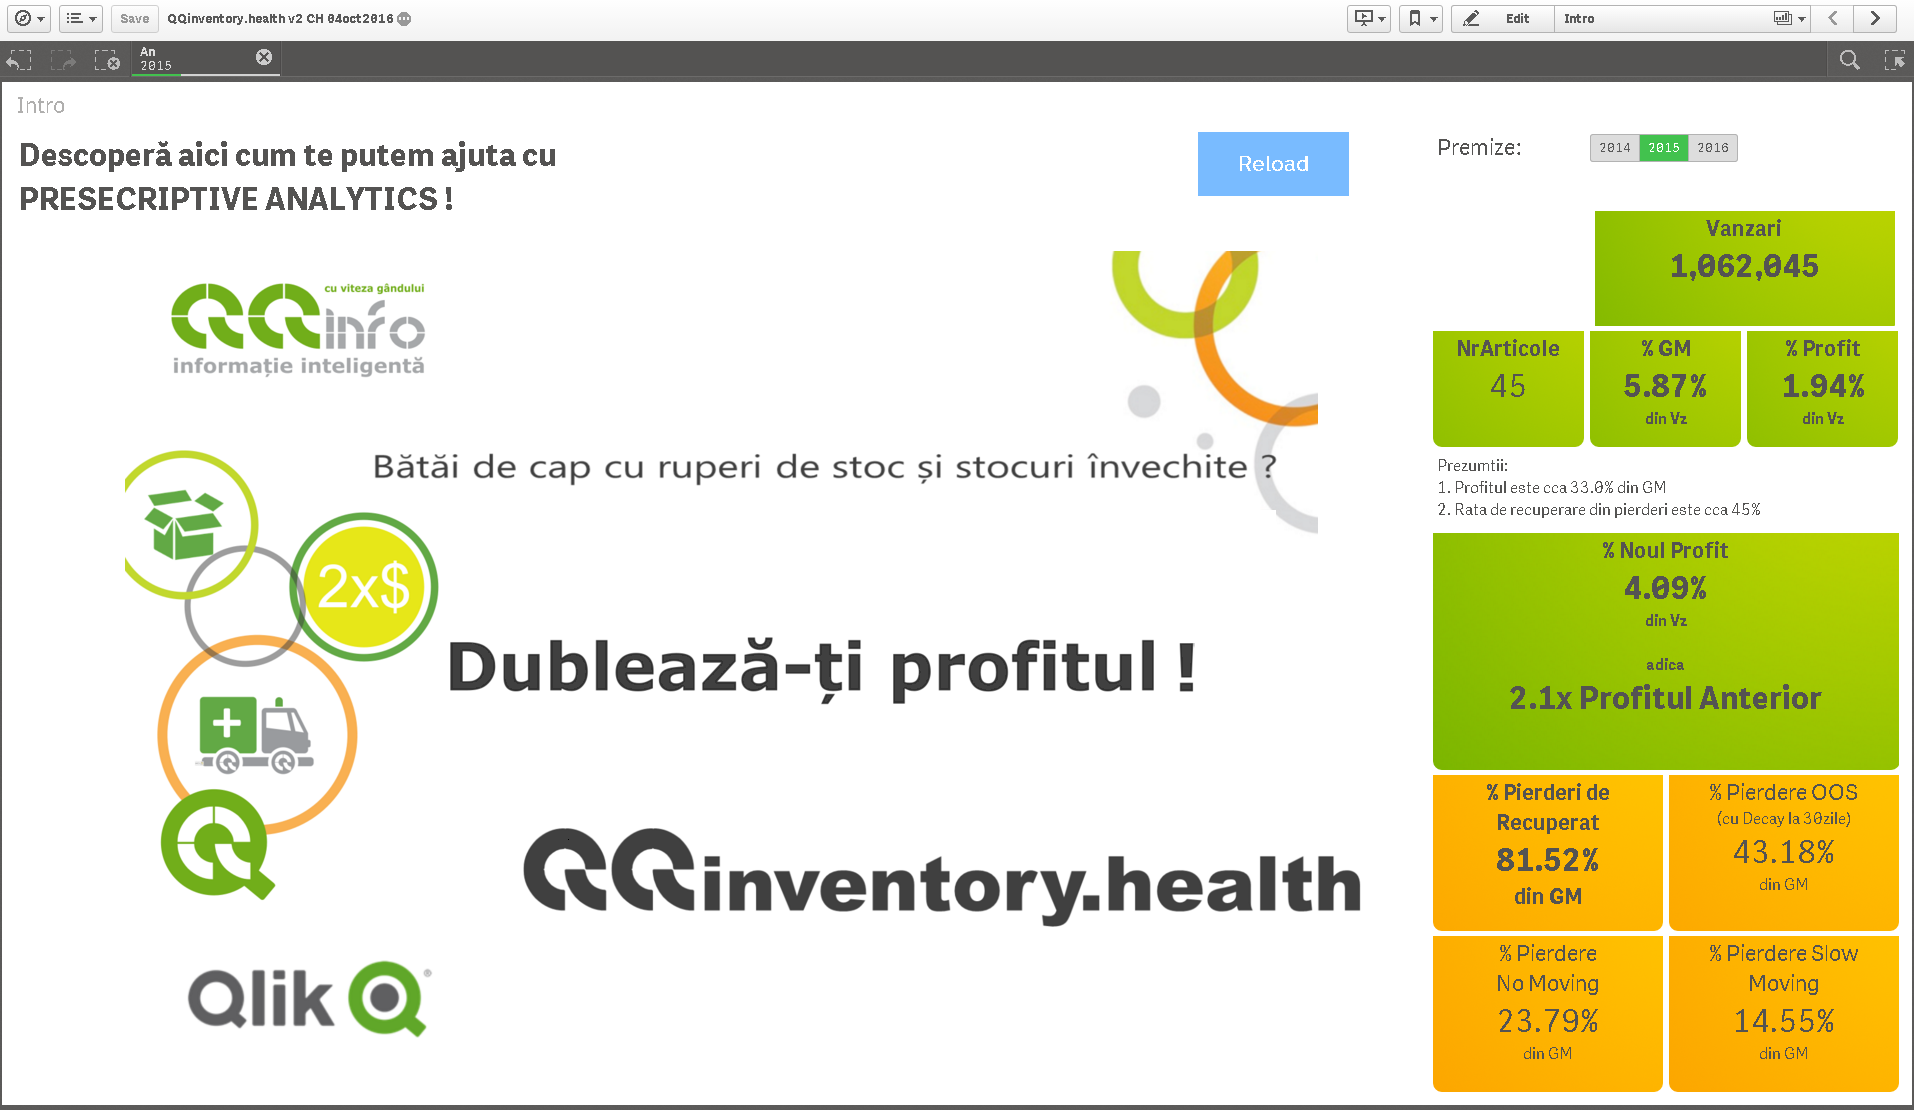
We have developed QQinventory.health™ as a visual and prescriptive analytics tool that starts from sales and inventory movements history in order to identify the situations when Out-of-Stock (OOS), No Moving (NoM) and Slow Moving (SloMo) occurs.
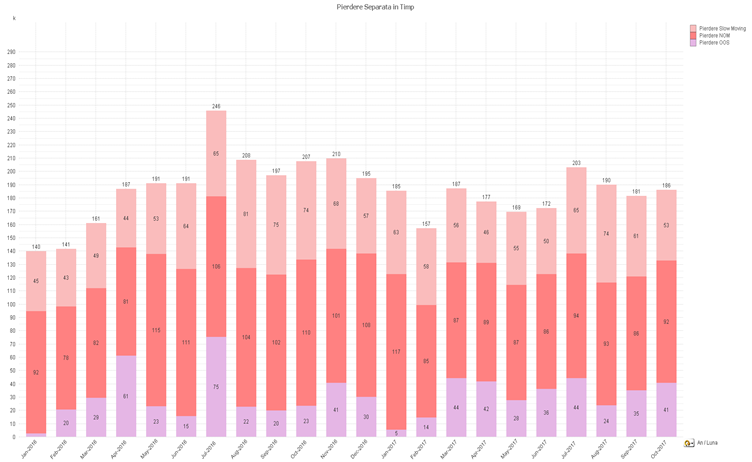
More than that, for each of the above mentioned situations, we have identified and implemented methods to evaluate the associated losses a so we can easier understand the inventory issues we are facing, find out if the situation is chronic or not and prioritize the impact they have in the general profitability of the company.
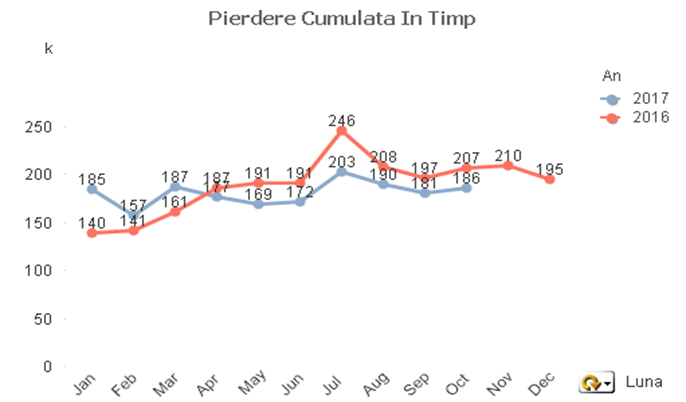
This integrated solution, developed by QQinfo, evaluates the value of losses recorded in the past, determined by situations such as Out of Stock, No Moving or Slow Moving, in absolute value and/ or percentage of recorded sales.
The QQinventory.health™ analytics set primarily highlights global values, but is based on detailed caalculations, at a very fine level of granularity, namely DATA-ARTICLE-MANAGEMENT. For this reason, QQinventory.health™ allows the analysis and highlighting of losses caused by each of the three situations (OoS/ NoM/ SloMo) at any level, overall or in detail, by articles or categories thereof, by management or categories thereof or for finer or longer periods of time, or any combination..
Note: for situations with many tens or hundreds of managements, the volume of calculations involved is very large, a situation in which we recommend the elimination of non-commercial managements and the consolidated calculation.
For evaluating OOS, first we identify the days, locations and products that ever recorded out of stock moments. For each such situation we evaluate the gross margin loss based on previous period daily average margin of the item, also the redirect factor and the consumer memory daily decay coefficient, specific to each article category. In order to avoid crazy evaluations, we take into consideration also the end of life timing of each product, if this information is available.
For NoM și SloMo, our analytics takes into consideration the identified costs of financing, stock keeping (warehouse, insurance, etc.) and depreciation (both moral and or physical). Everything is calculated at the granularity of article, day and location, allowing this way analytics at any relevant of detail or consolidation.
Only identifying the situations and the impact of OOS, NoM and SloMo is valuable, but not enough. This is way our solution goes beyond, providing focused, coherent and prioritized action proposals, in order to solve promptly and to prevent unwanted deviations. This is part of our offer of PRESCRIPTIVE ANALYTICS.
For more details on how we can assist you to have a healthier inventory distribution, contact us !
If you are interested in QQinventory.health™ product, please fill in the form here.
For information about Qlik™, please visit this site: qlik.com.
For specific and specialized solutions from QQinfo, please visit this page: QQsolutions.
In order to be in touch with the latest news in the filed, unique solutions explained, but also with our personal perspectives regarding the world of management, data and analytics, we recommend the QQblog !