Monitoring analysis of staff activity in the company
As a follow-up to the previous article, in which we presented some of the timekeeping analytics developed by the QQinfo team, in this article we will present some of the analytics used to monitor and measure staff activities in a company.
Nowadays it is well known that staff activities are no longer directly linked to present time, so it becomes necessary to measure not only attendance but also the effort put into each activity. The concept we have developed to help us do this is called WORK LOGGER.
A first such analysis is the analysis of effort vs. number of tasks and actions.
The left side shows the top of the number of tasks vs. the top of the number of relevant tasks (tracked in this case on the Department dimension). The right side shows the top of the number of actions, the top of the number of relevant actions and the top of the number of relevant replays.
The bottom part of the graph is “dedicated” to the presentation of effort: on the left side relevant effort vs. cumulative task duration, and on the right side average relevant effort vs. average cumulative task duration.
The Combo Chart object shows (over time) the evolution of the number of relevant tasks, the evolution of the number of actions and the average duration per task.
The Combo Chart below shows the evolution over time of relevant effort in hours vs. average duration per relevant task.
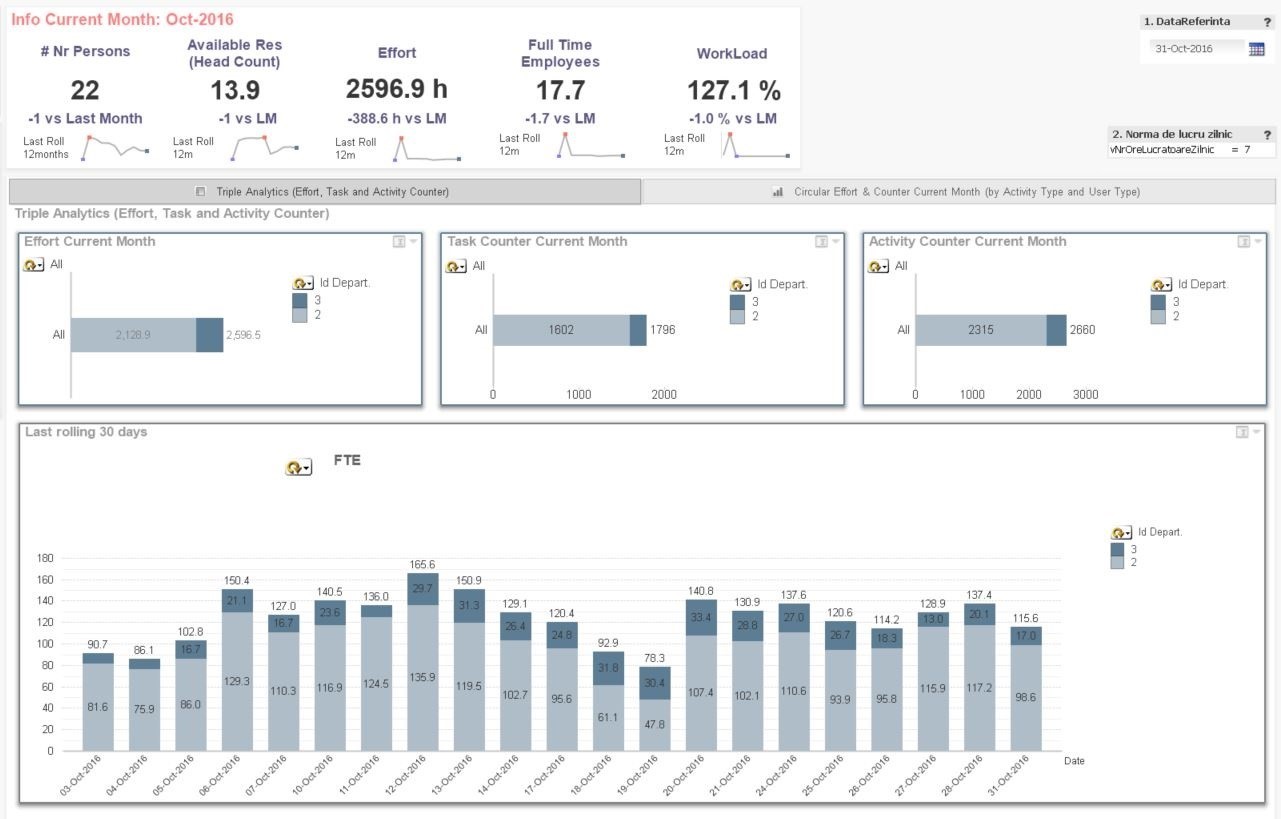
The information we can extract just from a view like the one above (Dashboard view) are:
The number of people working in the month under review (October 2016) was 22 employees, 1 more employee than the previous month;
Graph of change in the number of staff over the last year analyzed;
The load of all employees was over 100%; Effort graph by department and graph of the number of tasks completed by the 22 employees in October 2016;
Graph with the evolution over time of FTE (Full Time Employee) by various dimensions, according to need.
*The page expresses the results recorded during the reference month, including in comparison with the previous month. The reference month is defined as the month in which the Reference Date is included (by default it is the current month, but can be changed from the calendar object ”1. ReferenceDate”.
*The Full Time Employee (FTE) formula also takes into account the general parameter Daily hours norm, which can be changed from the object ”2. Daily work norm”.
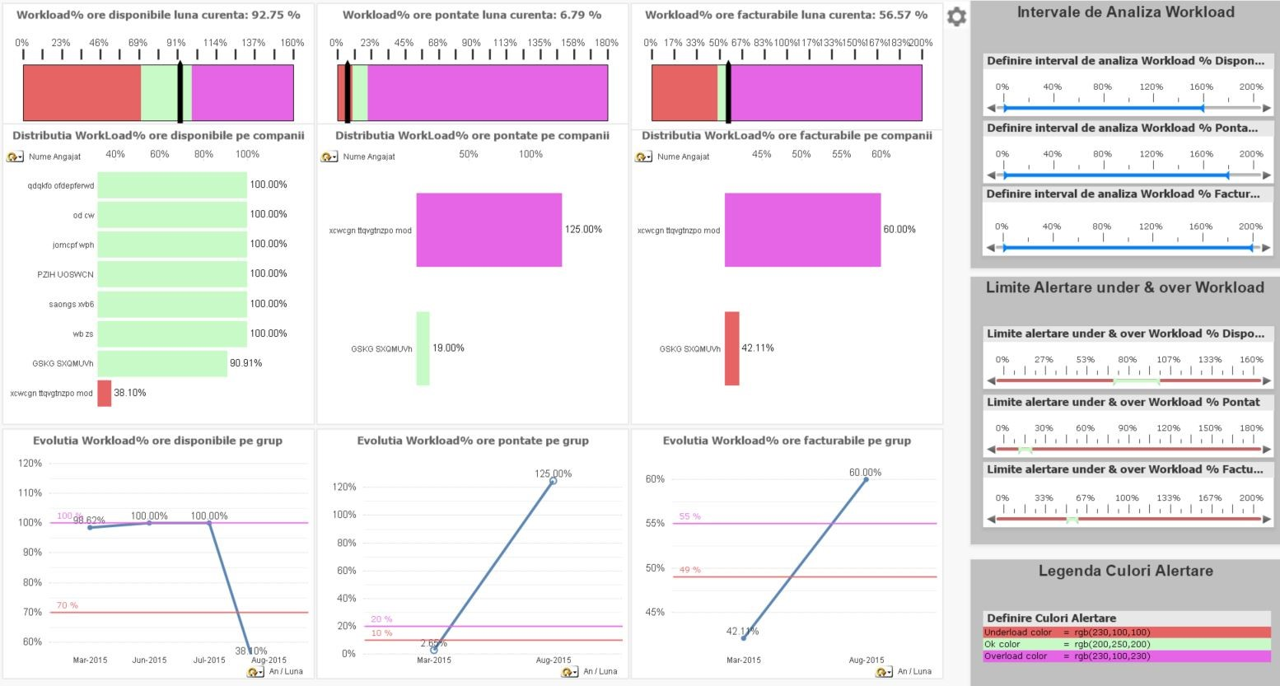
The page combines information on attendance with information on activities performed and billable hours. To close the loop all the way, the analysis can be extended to hours billed and then collected.
The analysis is intended for top management for the overall analysis of the current state of performance indicators for the last closed month (with drill-down mechanism from Company to Departments: when selecting a company, the size is automatically changed at department level).
The monitored indicators are:
Workload % Available = Percentage of hours available vs. standardized hours;
Workload & Logged = Percent logged hours vs. Hours available;
Workload % Billable = Percentage hours worked on projects vs. Total hours logged.
For each of these indicators there are 3 objects of analysis:
Gauge Chart with 3 ranges;
Bar Chart with horizontal descending bars;
Time Variation Chart.
Reference levels for each of these 3 indicators can be set by the user.
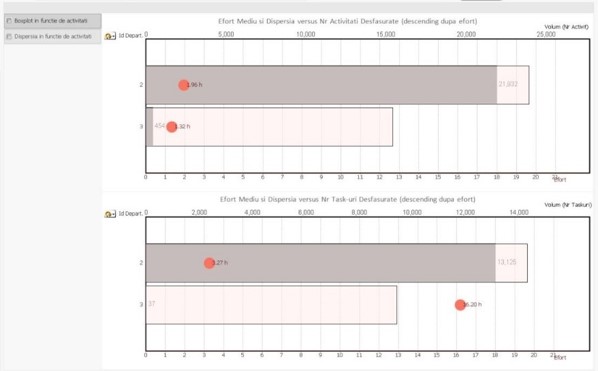
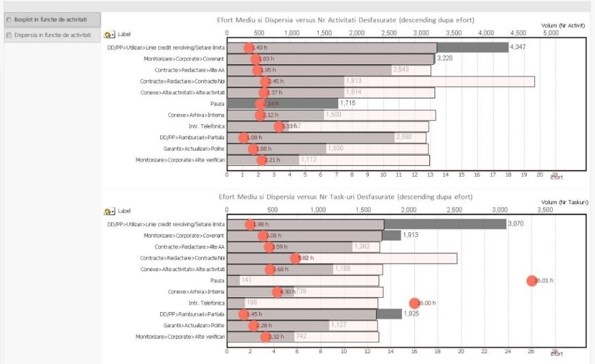
There are also situations where visualizing the spread of runtime values for process types can bring a better understanding of insufficiently classified situations.
The graphs show the analysis of Average Time or Effort and Variation (from minimum to maximum) for the activities that have been selected (by time, by department or person, but also by type of activities carried out).
The specific number of activities carried out for each typology analyzed is also highlighted, to help us identify phenomena with a high incidence, with a major impact on the total activity, but also those that create an extreme variation in duration or effort, even on a low incidence.
Here are other examples of analyses developed by the QQinfo team useful when a better understanding of the processes that took place on the HR side is needed (effort expended, relevant effort, number of tasks, workload, etc.)..
If we have made you curious, feel free to contact us for any information at office@qqinfo.ro. You can also find us on Facebook, or LinkedIn.
What has been presented in this article represents only a small part of the range of analyses developed on the HR side!
For information about Qlik™, please visit this site: qlik.com.
For specific and specialized solutions from QQinfo, please visit this page: QQsolutions.
In order to be in touch with the latest news in the field, unique solutions explained, but also with our personal perspectives regarding the world of management, data and analytics, we recommend the QQblog !
This website uses cookies to improve your experience. We'll assume you're ok with this, but you can opt-out if you wish.AcceptRejectRead More
Privacy & Cookies Policy
Privacy Overview
This website uses cookies to improve your experience while you navigate through the website. Out of these, the cookies that are categorized as necessary are stored on your browser as they are essential for the working of basic functionalities of the website. We also use third-party cookies that help us analyze and understand how you use this website. These cookies will be stored in your browser only with your consent. You also have the option to opt-out of these cookies. But opting out of some of these cookies may affect your browsing experience.
Necessary cookies are absolutely essential for the website to function properly. This category only includes cookies that ensures basic functionalities and security features of the website. These cookies do not store any personal information.
Any cookies that may not be particularly necessary for the website to function and is used specifically to collect user personal data via analytics, ads, other embedded contents are termed as non-necessary cookies. It is mandatory to procure user consent prior to running these cookies on your website.