After more than 10 years spent in coordinating the marketing of some top Romanian companies and over 15 years of entrepreneurship and overlapping the cumulative experience of Marketing with that of Data Engineering and Business Intelligence, including the dynamic area of online sales and marketing, the result is this article, which highlights how proper and high-performance managerial analytics can add value to a company’s marketing, regardless of the industry in which it is involved.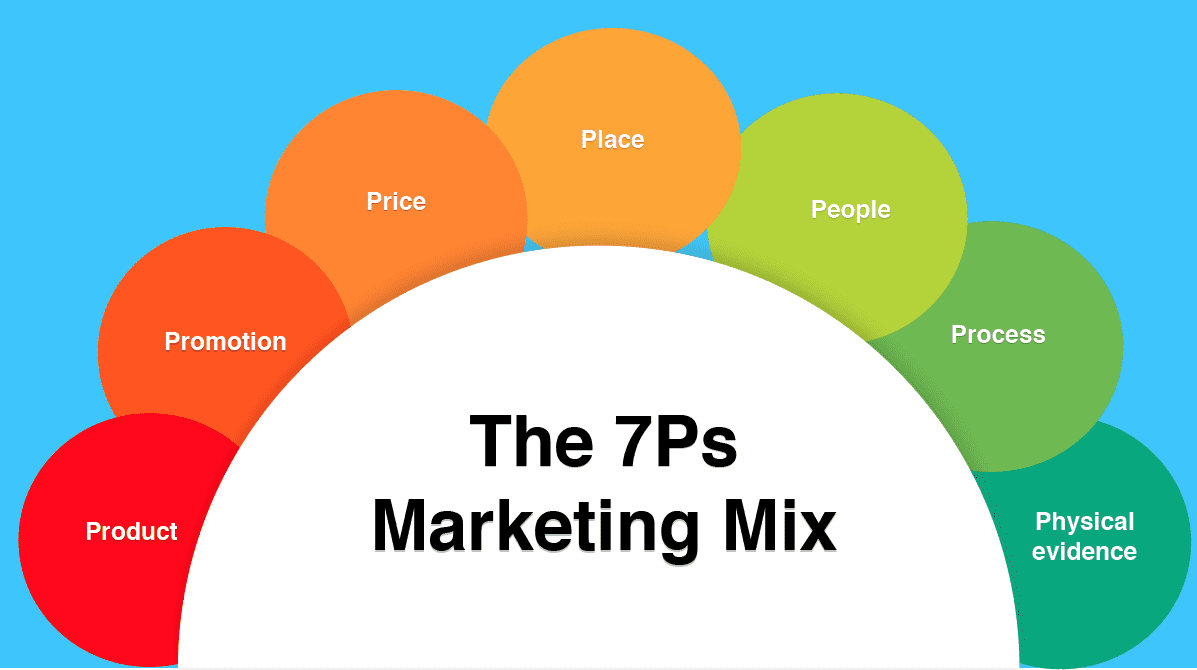
Here is a summary of the contents of the article
BI in the 4+3P of Marketing
First, we should point out that in the general context of Marketing, as defined by the father of the field, Philip Kotler, the elements related to Promotion are only a small part of the whole story. Kotler defines the marketing mix as consisting of:
- Product Management
- Price Management
- Placement Management
- Promo Management
Later, 3 more components are added:
- People Management
- Process Management
- Physical Presence Management
So, starting from the 7 basic components of the marketing mix, we will present here how a set of analytics, well oriented and delivered by a high-performance BI platform, can add value in increasing the marketing and sales performance of the company that adopts them.
Product Management
Choosing the right products is essential in the current market conditions.
Scatter Analysis Sales -% Trading Margin
With the help of these analytics, one can quickly identify the performing and non-performing portfolio on any of the analyzed dimensions.
In the upper right are the golden hens, who must be given maximum attention and confidentiality, in the lower left are the “losers” who must be moved to the right and / or up, or given up.

Scatter Cloud Analytics in
QlikView™ dashboard
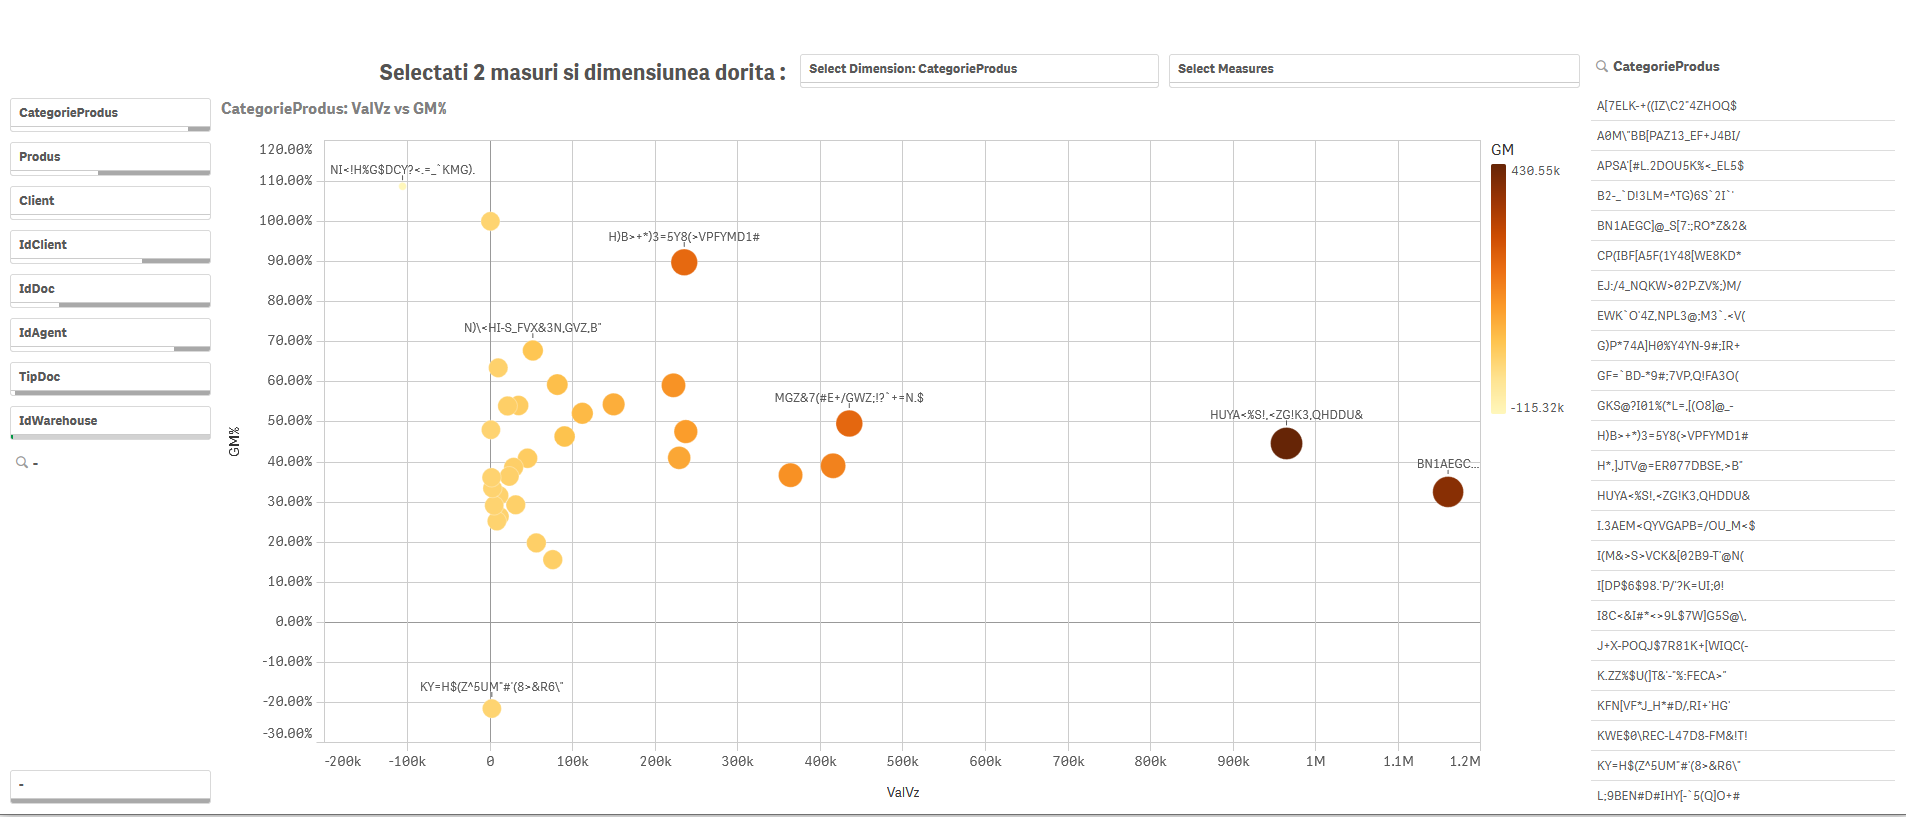
Scatter Cloud Analytics
in Qlik Sense™ dashboard
Boston Consulting Group Matrix
With this analysis, it can be identified the early stages of maturity within some compartments of the business, allowing earlier and implicitly more effective strategic and tactical decisions.
With this type of analysis, stars, dairy cows, and other classifications specific to BCG matrix modeling can be quickly identified.
BCG modeling can be further developed to GE-McKinsey modeling (where several quantitative elements specific to this modeling are available, we do not recommend the implementation of this modeling in the first phase only in extremely mature organizations, which already have a massive history in gathering information complexes required for this modeling).

McKinsey - General Electric Matrix
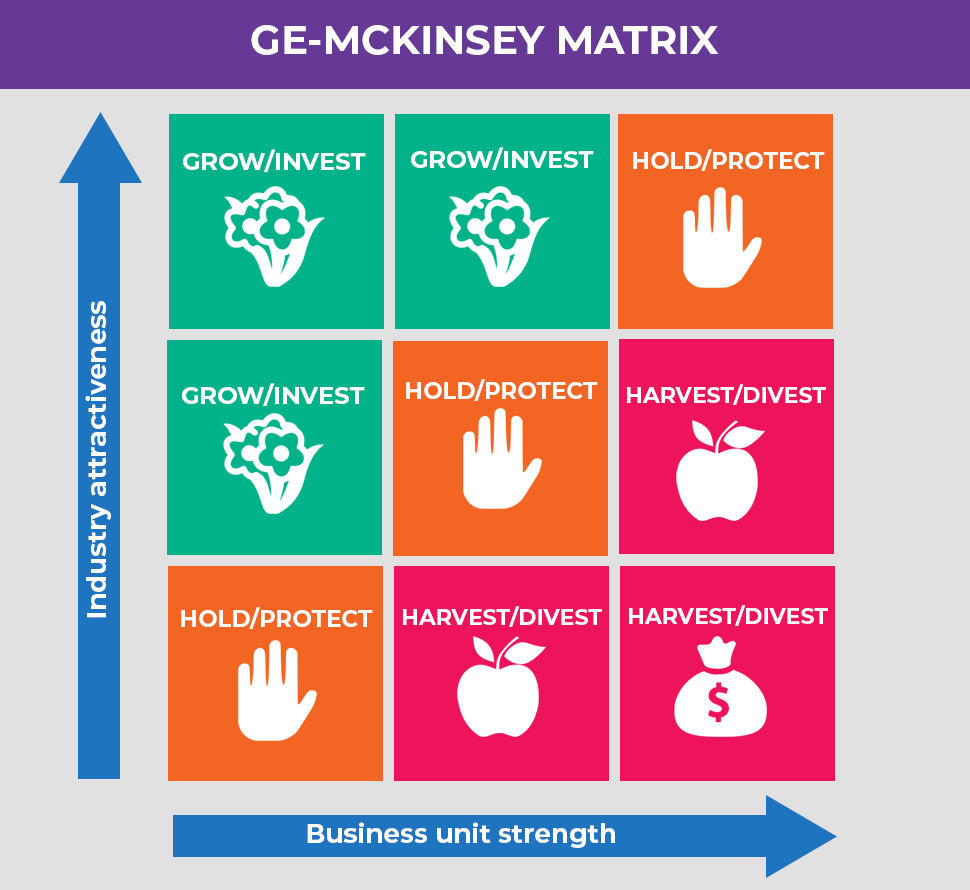
The strategic analysis of the markets, proposed by General Electric and McKinsey in the 70’s, related to the attractiveness of the market segments and their own capabilities in those segments, can be declined today at any level of granularity, even at the level of SKU, once with the definition of intermediate metrics to evaluate the 2 strategic indicators, automatically, throughout the space of entities/ market segments analyzed.
Price Management
What price is right ?
Today, price decisions need sophisticated IT support to optimally define prices strategically, tactically, and operationally.
Decisions are related to focus areas, what they need, specific tools.
The percentage markup trade approach is only a first point of reference today.
But what is the real and total cost of our products and services ?
- Particularly, in highly competitive markets with low trade margins, control over gross trade margin is no longer sufficient. The impact of pricing policies on buying and selling, especially in commercial channels that involve several off-invoice discounts. Failure to take them into account can significantly alter the profitability analysis and hence greatly affect the quality of the pricing decisions they make.
- Even if the pressure on margins is not as high for production companies, pre- and post-price calculation methods require more and more advanced calculation tools, including activity-based costing tools.
- And in many other industries, allocating marketing, cash, logistics, warehousing, operating, R&D, financing, etc. costs can be a major challenge in getting the core cost as close to reality as possible. Again, activity-based costing or the application, at least in part, of some allocation methods.
QQslicer™ is a reconfigurable algorithm from our QQcomponents™package, extremely flexible that allows fast application of some processing, with the division on multiple keys of the existing values in certain types of financial or other records.
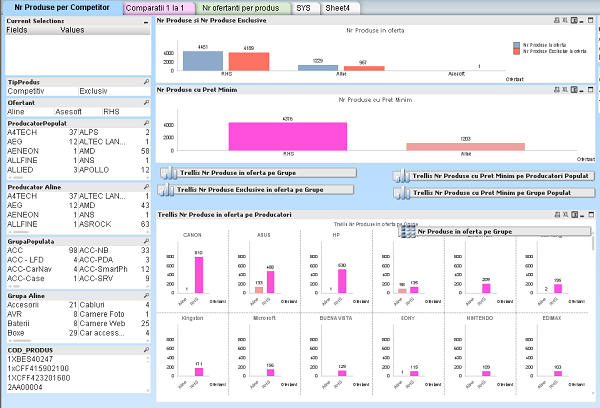
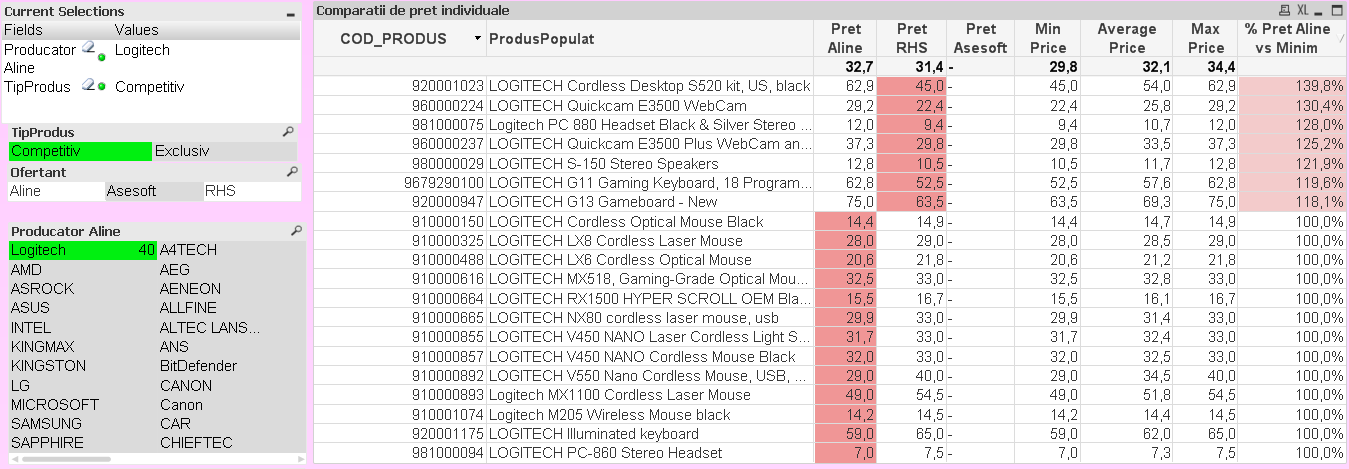
Competitive Pricing – how do we position our prices relative to those of the competition ?
- Identifying the position of competition prices in relation to their own product prices, identical, similar, or approximate, is an important point in pricing, both at the operational level (especially in highly competitive contexts, such as online commerce – especially marketplaces), as well as at a strategical and tactical level. With different operational, tactical, and strategic goals, the necessary analyzes have different nuances of approach and especially processing.
- Launching and sustaining Best Price Guaranteed communications usually needs an impact analysis, for which is essentials again..
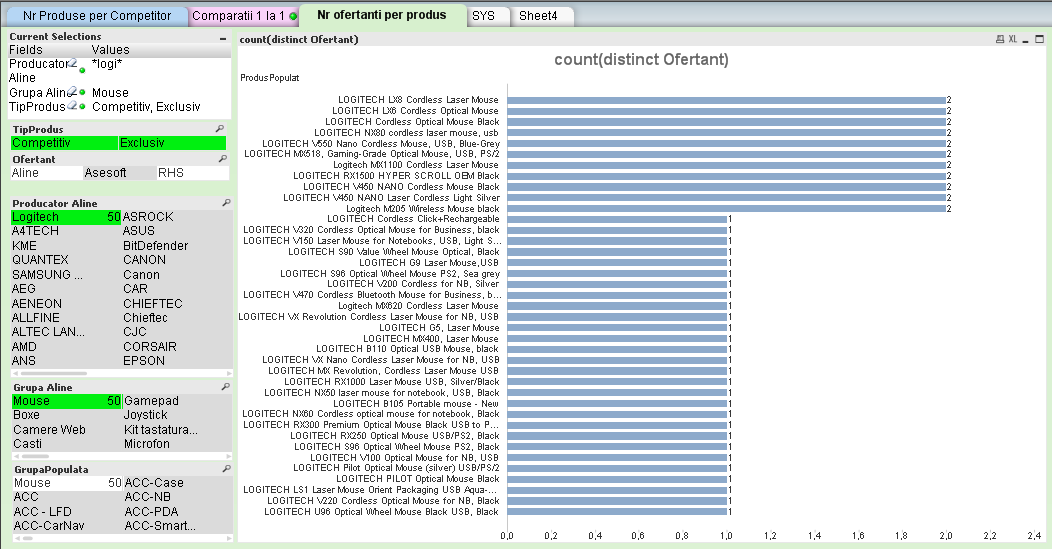
We have several approaches for positioning analytics of own prices in relation to competition, both at the individual product level, and in terms of positioning average or minimum prices.
Including algorithms for matching items from your own offer with those of competitors.
When, where, why and especially at what value should we set prices ?
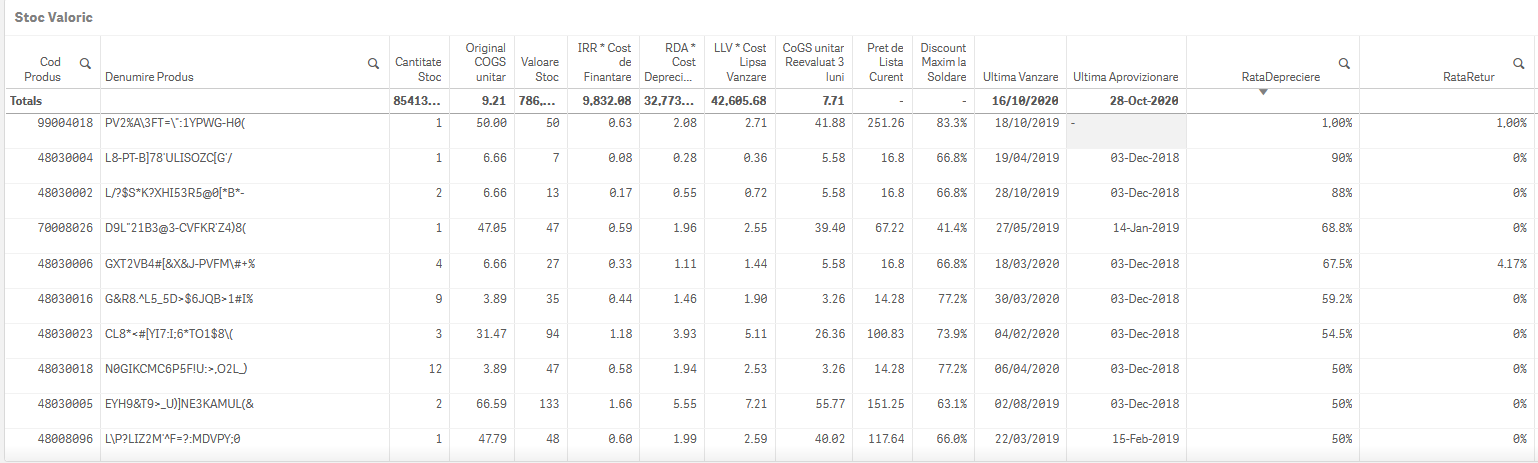
Timely identification of situations requiring price intervention can become an almost impossible task when the number of products managed is significant.
And not only identification can be a challenge, but also prioritization of situations that require intervention.
High-performance analytical tools that quickly highlight situations that require price changes, prioritize them, and then even make price proposals (preferably ready-rounded, at .99 prices, including VAT), ready-integrated could be useful.
More details on these topics can be found in the description of the solutions:
- QQinventory.basic (qqinfo.ro/solutii/qqinventory)
- QQinventory.prioritize (https://qqinfo.ro/en/qqsolutions/qqinventory-prevention/)
- QQpricing (qqinfo.ro/qqpricing)
What is the impact the new price will have on the commercial margin ?
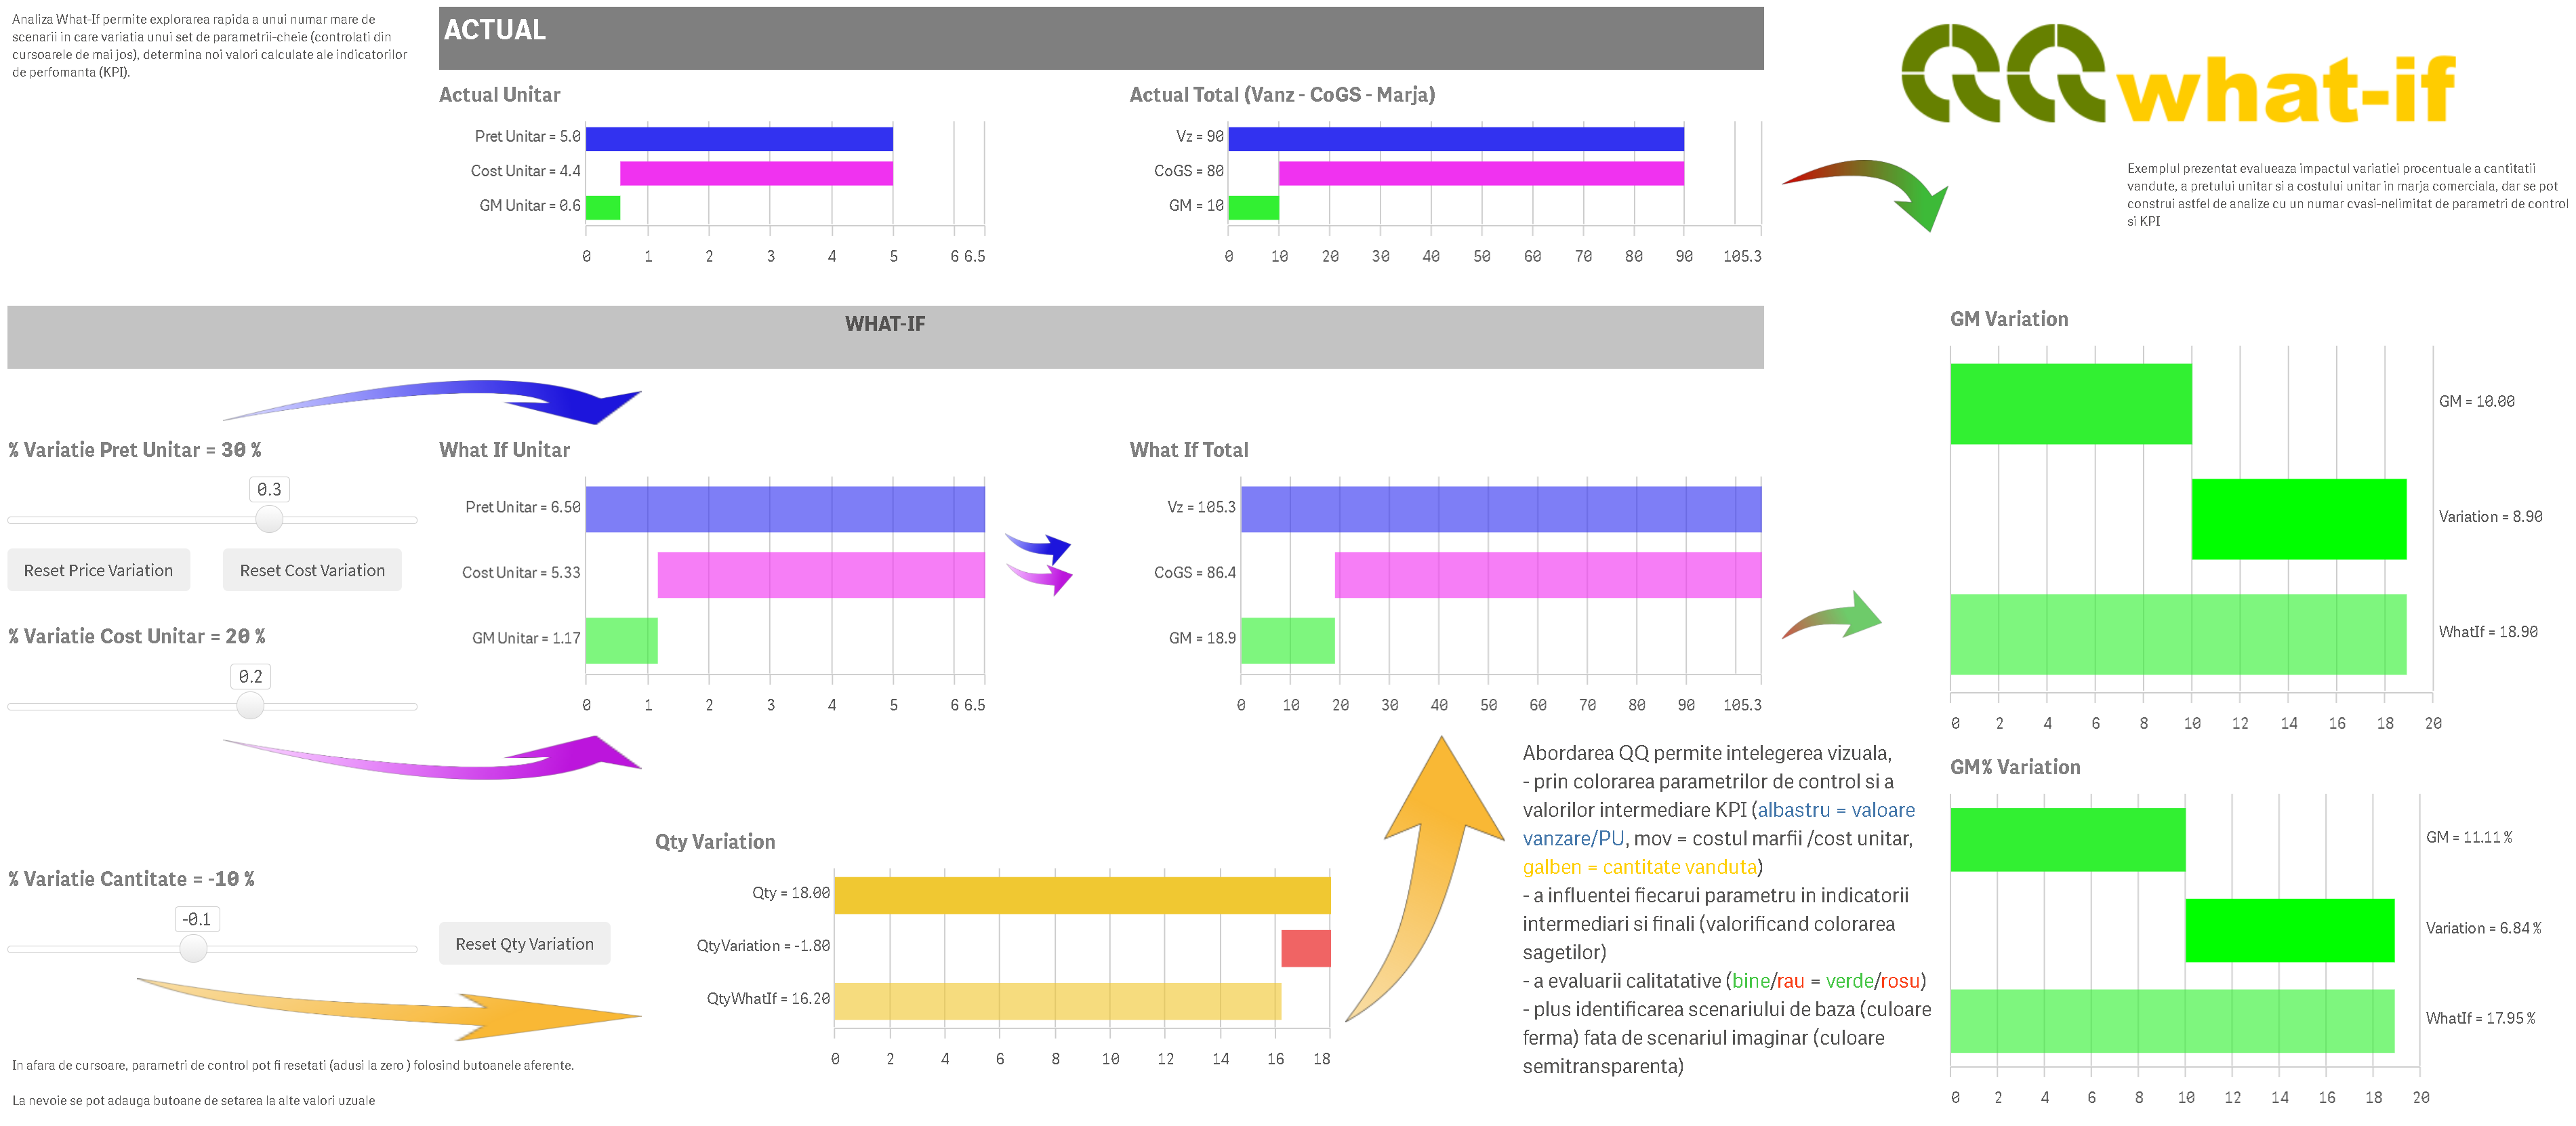
A price change may be appropriate for several operational reasons, but it is often necessary to overlap several analysis perspectives, sometimes with conflicting trends, to make the right decision. What-if analytics, or at least a quick look at the immediately calculable results of the proposed new decisions regarding the remaining trade margin, are certainly welcome.
The impact shall be analyzed immediately in all relevant indicators in the context, including the resulting percentage margin difference.
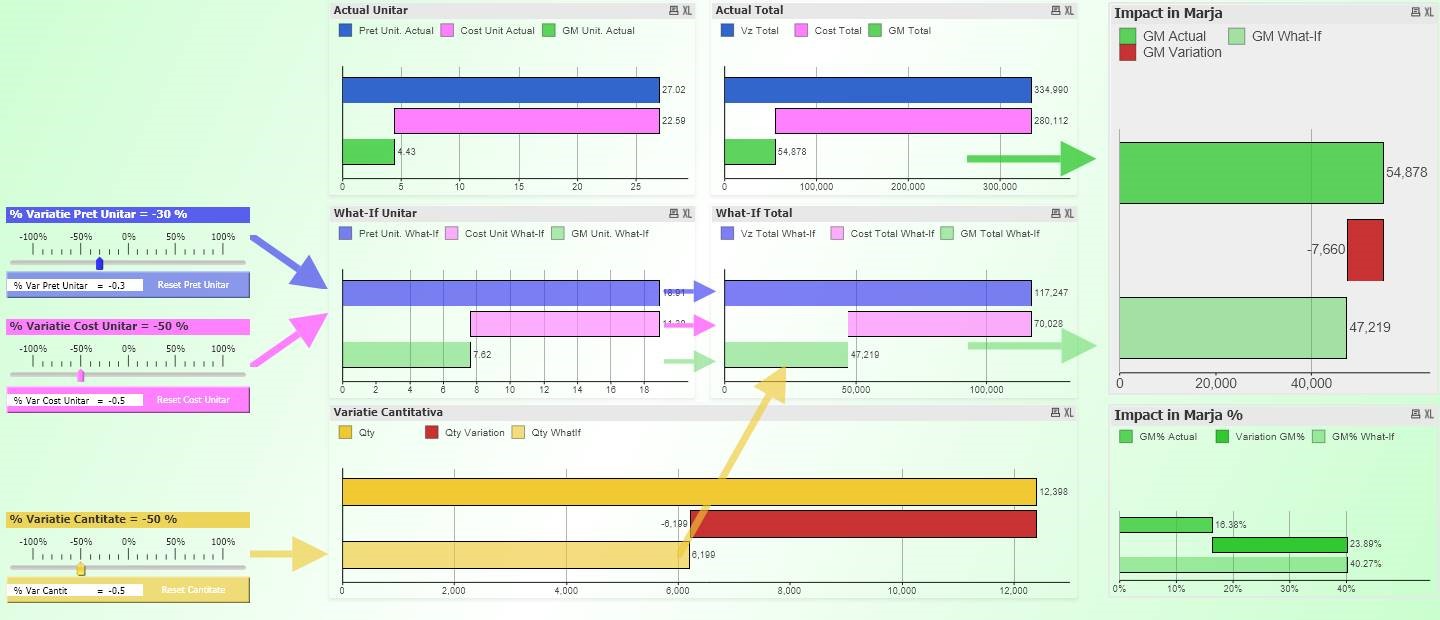
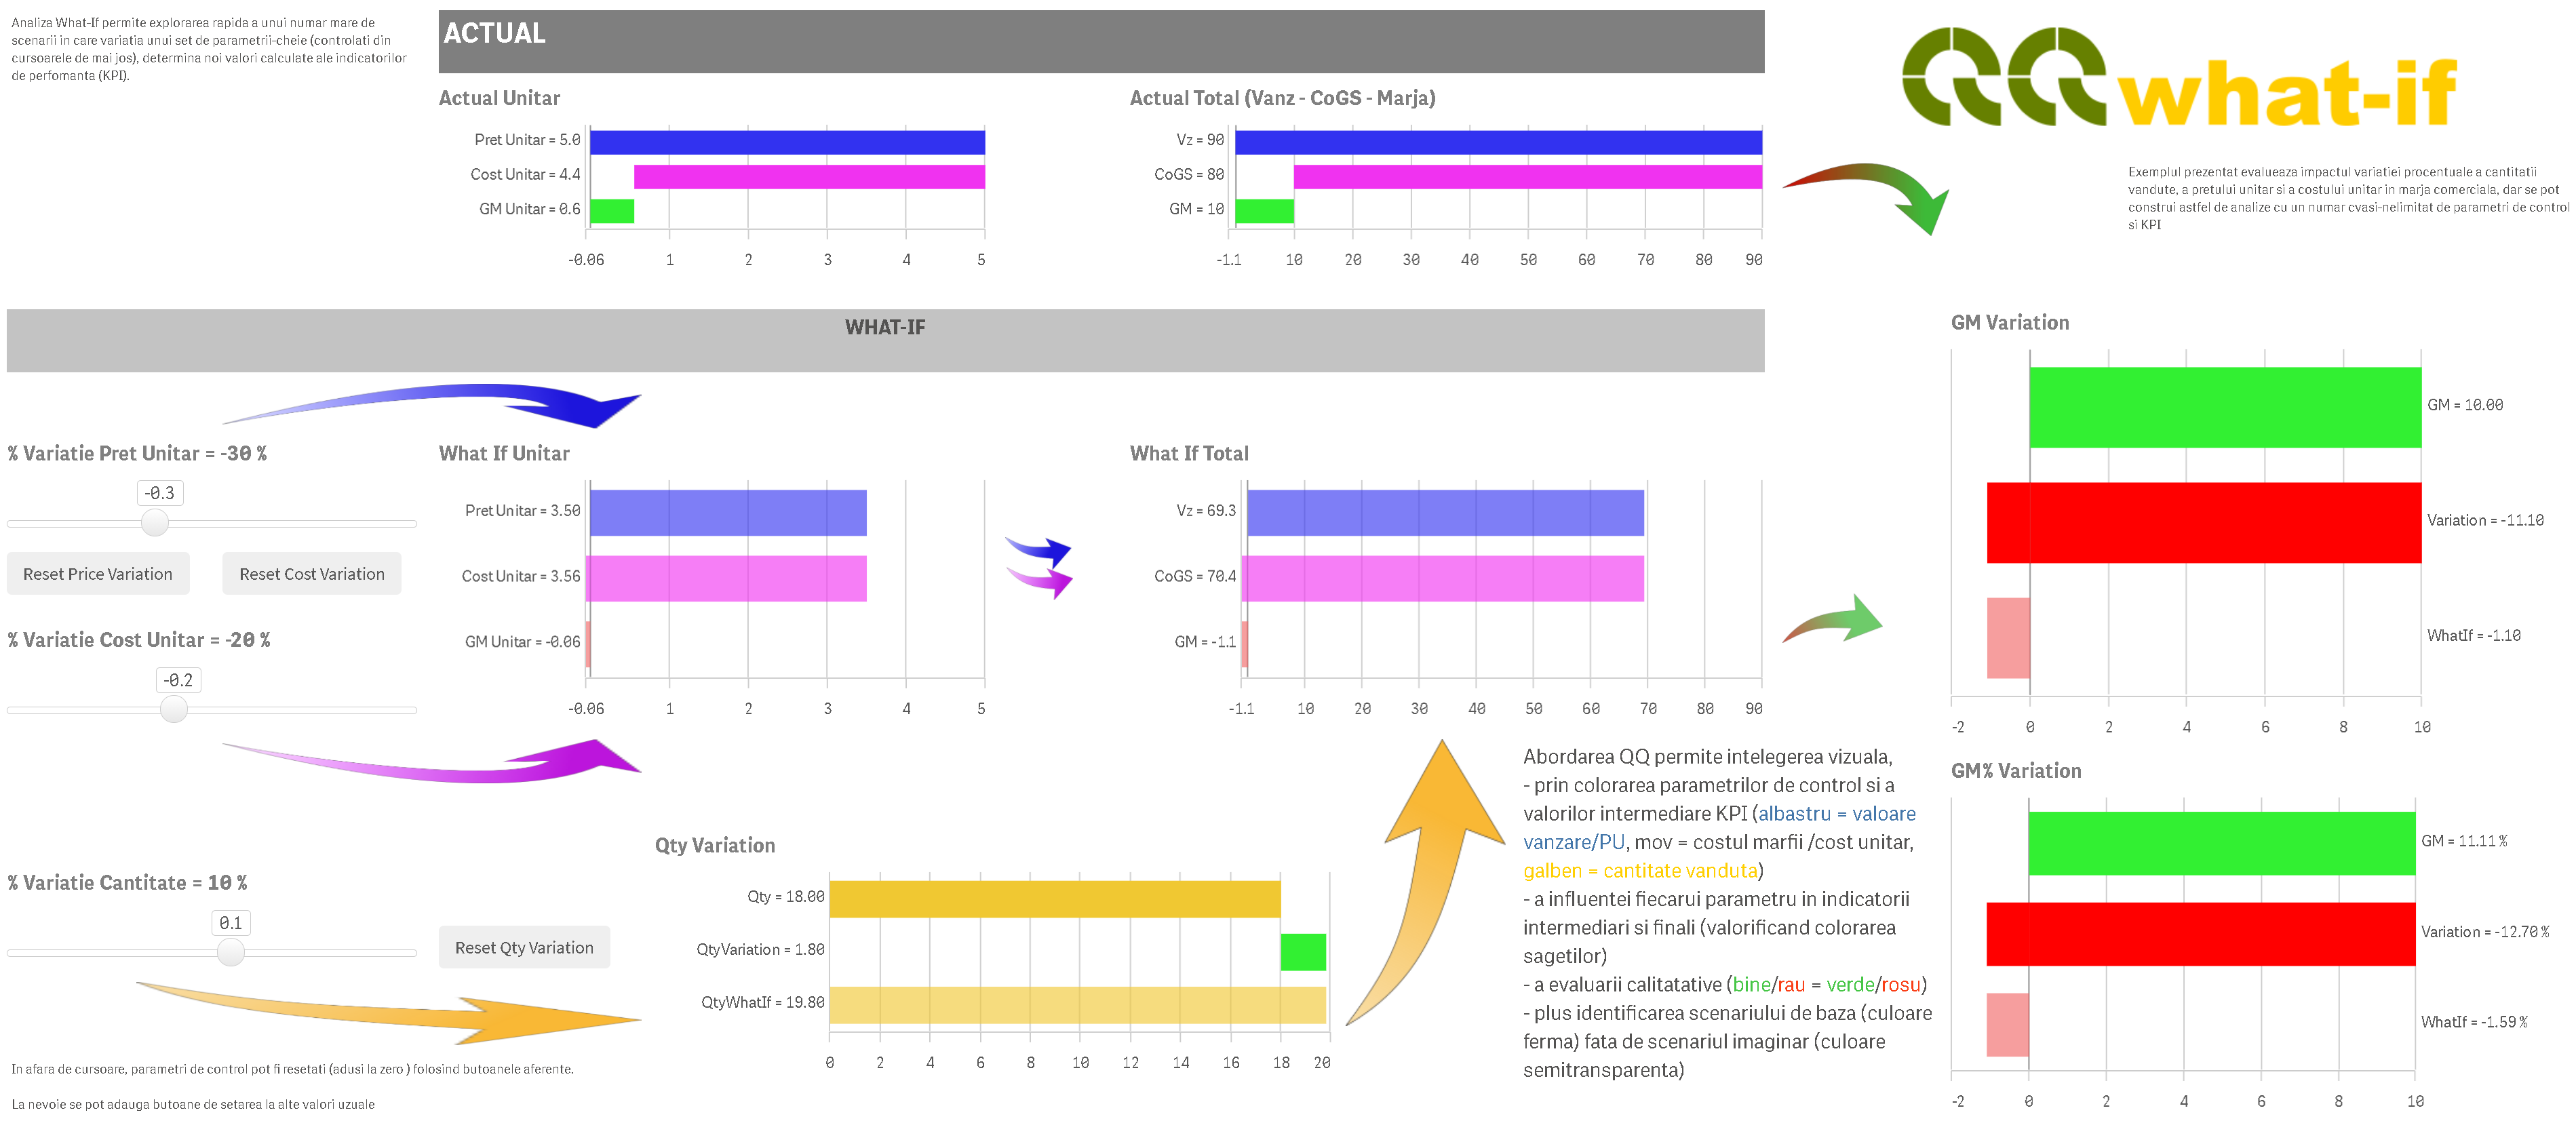
What-if Anaytics in QlikView™ dashboard
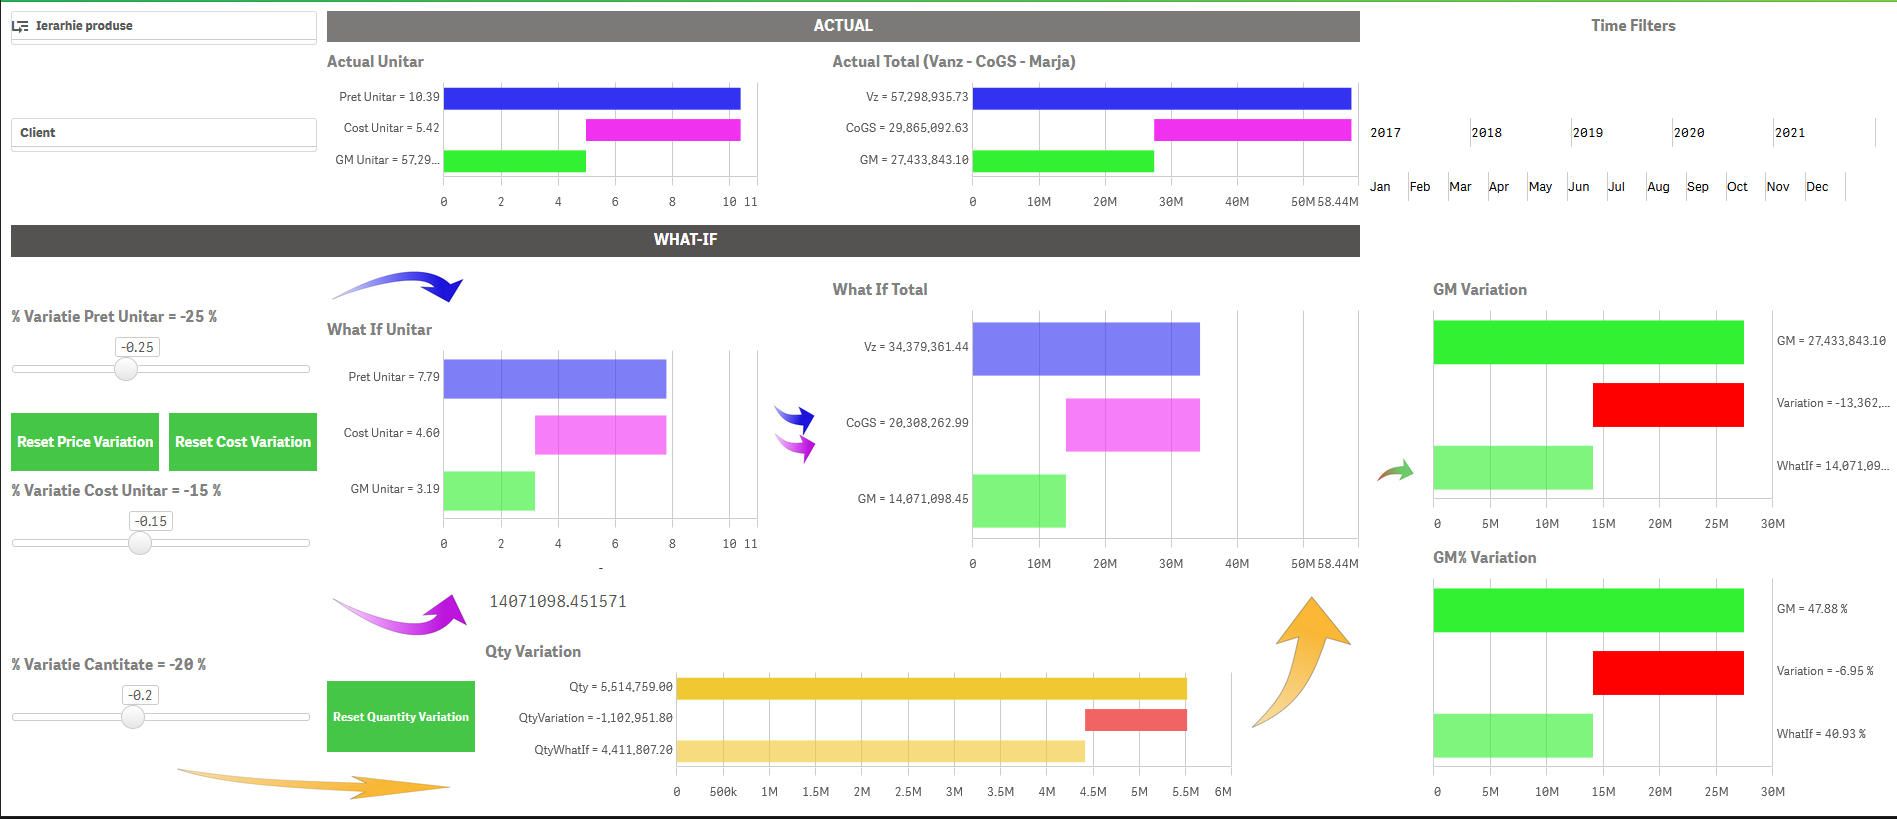
What-if Anaytics in Qlik Sense™ dashboard
We presented 2 scenarios over the same set of departure dates.
Although it seems slightly counter-intuitive, there are quite a few situations in which, rather than making a significant discount to increase the quantity sold, it is more profitable (in terms of the net value of the commercial margin) to sell with a higher addition and slightly smaller quantity.
In the second case presented, although it seems in the mirror with the first, the difference in profitability is dramatic, leading to higher total costs than revenues and a negative net margin, not just a decrease in margin.
This analysis can be performed both globally, or on a relevant selection in context, but also individually, at the level of article, product category, manufacturer, etc., as seen below.

What-if Analytics in bord QlikView™ dashboard
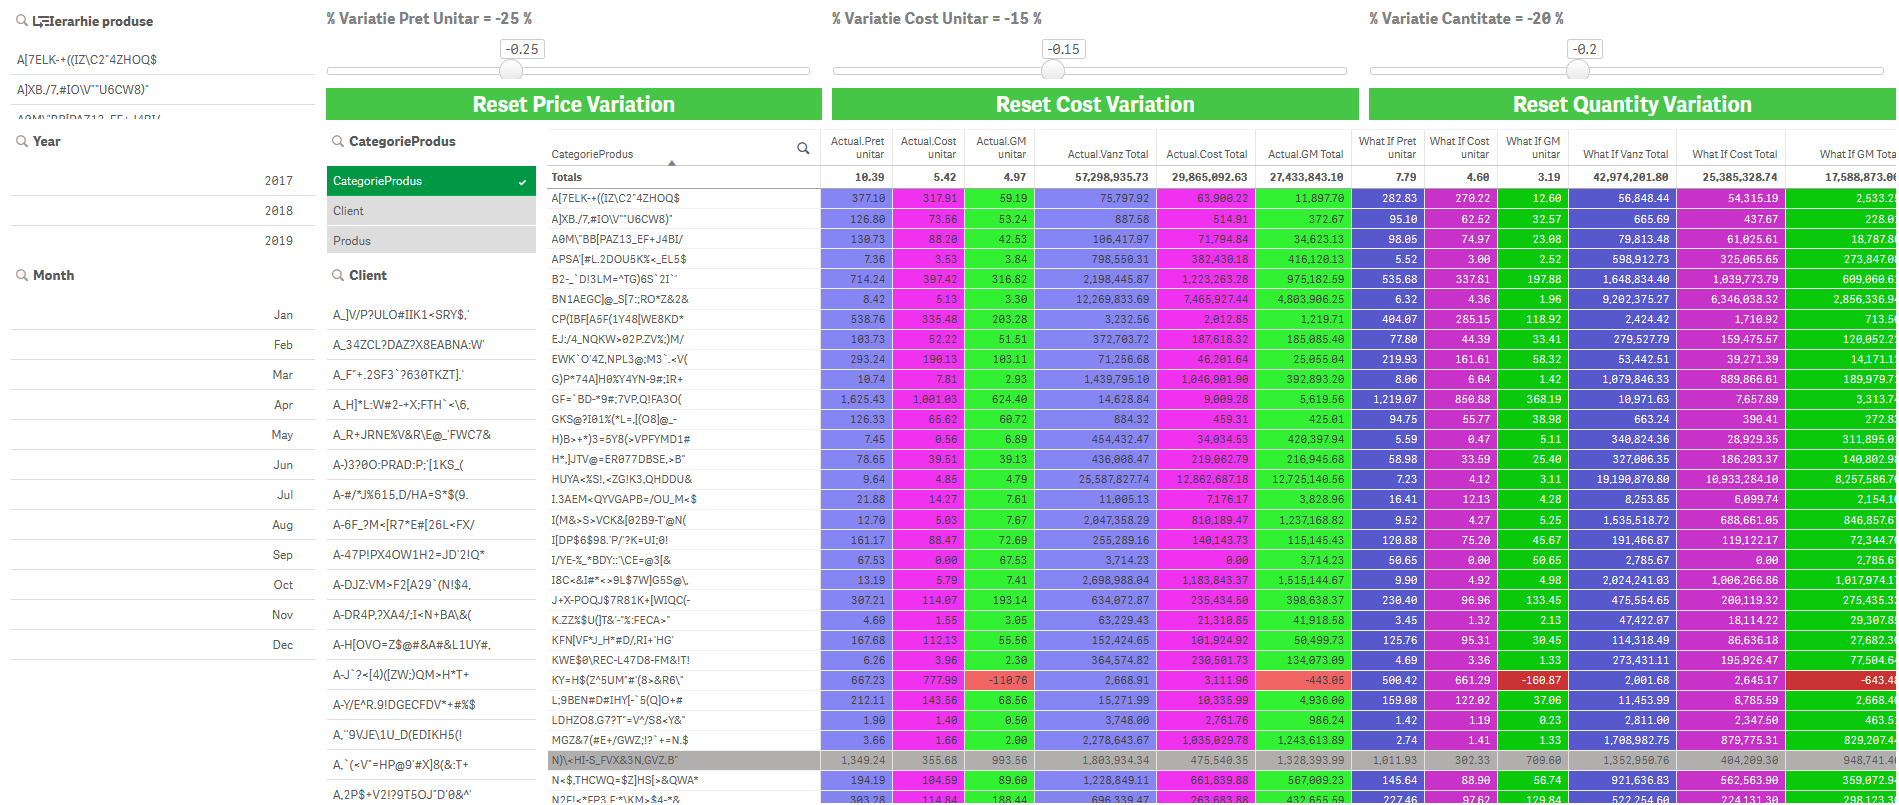
What-if Analytics in Qlik Sense™ dashboard
What do we intend to achieve with the price change ? For how long ?
When defining a new price, it is extremely useful to keep in mind the specific causes and objectives assumed when defining the price, for further analysis. The expiration date of the price, and / or the time horizon that we anticipate for further analysis, are also worth saving with the new decision.
It is worth adding to the above the definition of relevant classifications of pricing actions, which we can later use to interpret and catalog the impact of our pricing decisions.
What did we do after the price change ? Did we reach our goals ? What knowledge can we extract ?
We changed the prices for some reason and with some objectives in mind (already retained in the system for future reference).
Putting together the objectives and classifications of the decisions taken with the actual impact of the implementation of the new prices, we can identify what and where it worked or not.
Beyond the specific or general objectives assumed at a definition or a change of price, and their level of achievement, it is important to understand the archetypes, typologies, patterns of situations encountered and from here, by generalization, to build (at least at mental level, if not computer science) more advanced models for future decision making.
How do we manage the prices of composite products (packages, gifts, vouchers, etc.) ?
Most, if not all, distribution, and retail companies (which do not produce their own products) are often able to combine several products into one package or offer gift products to other products sold.
Even if at first glance it does not seem to be about price management, the attractiveness component of these packages and gifts ultimately contains, at the root, another pricing problem (both from the marketer’s perspective and as a consumer’s perception).
As follows, these situations also require similar treatment, beyond the challenges of properly assessing allocated costs and business profitability.
For concrete stock liquidation proposals (items with weak or zero rotation), we have the NoMoving & SlowMoving Discount Proposals analysis package, part of QQinventory.basic™.
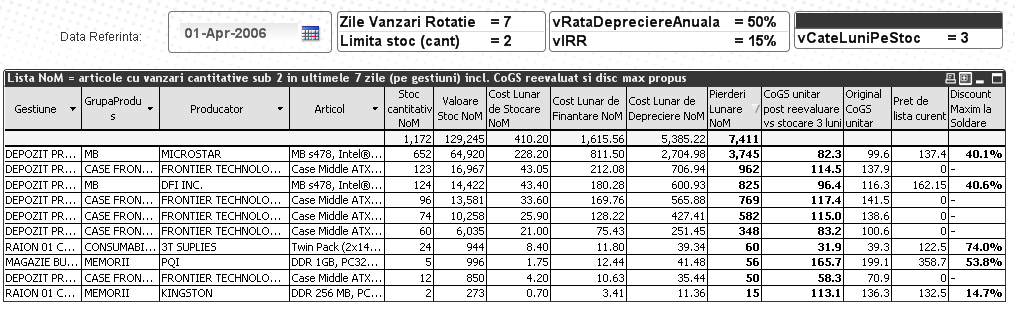
Once we have identified items that are still in stock, but with too much rotation (we call them Violent Moving), we can come up with proposals to increase prices to increase profitability at the same time as the slowdown in sales, a decrease that would allow us to have availability longer, until we manage to make the necessary replenishment.
More details about the price management and monitoring options offered by our integrated solution, QQpricing™, can be found here.
PS: QQpricing™ can be applied immediately and extended for use in the registration and monitoring of other promotions, including in cooperation with suppliers or manufacturers, thus opening new areas of integrated analysis.
Placement Management
In the classic trade, the merchandising part occupies the last hundred meters in the way of the products to the consumer. Both retailers, as well as distributors and manufacturers have merchandising programs in which they define and monitor the execution of location and signaling activities at the point of sale/ presence. There are often processes and dedicated staff, including programming software systems, but also auditing the correct and complete execution of merchandising.
Logistics, procurement, or replenishment processes are often outside the area of responsibility of marketing management (perhaps except for the supply logistics of POS communication products and packaging). But they can’t be ignored by marketing, because, after all, the negative impact of an extraordinarily executed promotion, but for which the merchandise has not yet reached stock, is, after all, still a challenge in the marketing area.
If, however, we turn our attention to online commerce, even if the terminology is changed, the basic principles, related to visibility, but also to the psychology of sales, or neuromarketing remain valid. An additional detail may come from the easier to measure nature of online commerce, that brings more techniques and metrics available in the process of improving and optimizing the “placement” of consumer-friendly items (A/ B tests, click heatmaps, automatic recommendations of equivalent or complementary articles, etc.).
Placement management is gaining new value in services, coupled with BTL communication in the physical world, because, in most cases, the services themselves cannot be viewed, but this does not mean that they do not have to be communicated at points of sale and/ or contact with the consumer. On the contrary, communication becomes the only chance to build the opportunity to sell and the need to buy in the mind of the customer. Implicitly, the measurement of the quality of the execution of the communication placement also comes to our attention.
Physical trade placement management
More details coming soon !
Positioning products on the shelf
More details coming soon !
Stock availability
More details coming soon !
Point of sale signage
More details coming soon !
Business placement and online communication management
More details coming soon !
Traffic Analytics
The analysis of traffic, browsing habits, dropout rates, web page loading times are, in fact, all, placement analysis, translated into the virtual world.
Many more details can be measured, compared to the physical environment, so everything becomes more complex.
And for maximum impact, these analytics must be integrated with the analyzes of the entire communication-marketing chain.
Stock availability
Even if we are talking about the world of online commerce, or maybe even more so, considering the technological capabilities of the moment, the consumer expects to find stock for promoted products and the negative image impact of stock breaks on products still actively promoted remains just as important. Therefore, stock management is also essential from a marketing perspective.
Promotion Management
The marketing dashboard is focused on social media. To successfully manage performance, social media scorecard is usually one of the best ways to measure progress and achievements. Let’s take a closer look at this example.
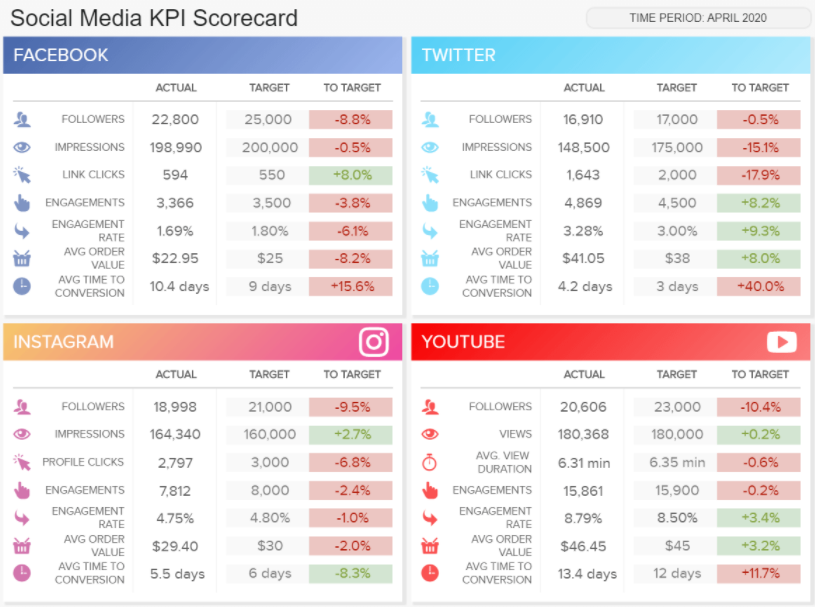
We can see this scorecard features 4 main social media channels: Facebook, Twitter, Instagram, and YouTube. Each channel is divided into a set of 7 metrics that are tracked in comparison to a set target and previous period. On Facebook, we can see that our number of followers is almost 9% below the set target, but 2.3% higher than the previous period. This part will simply tell us that our followers’ amount increased even though we haven’t achieved the target. We can apply the same logic into other depicted metrics: impressions, link clicks, engagement, average order value, and the average time to conversion. In the end, we can see that both the time to conversion and average order value have significantly decreased so we might want to investigate further what happened during our time frame and how to correct future performance.
We continue our social media scorecard template with Twitter. As we can see, this part of the dashboard also contains operational metrics such as followers and impressions. The color code will immediately tell you if the targets are being exceeded or fallen behind while the comparison to the previous period, in this case, monthly, will enable you to dig deeper into monthly correlations of your data. To put this into perspective, we can see that Twitter has issues with the number of link clicks, and the users’ time to convert. It even increased in comparison to the last month so we would certainly dig deeper to find out what went wrong: did the user behavior change, our posts don’t show to the right audience, or a completely different reason? It’s time to investigate. This KPI scorecard can be also shown as a client marketing dashboard in case a social media manager tracks the performance of the client’s SMM (social media marketing) efforts within a designated period. It can significantly reduce time to create manual social media reports for each campaign or agreed strategy while the simple visuals in red and green can provide insights immediately. Such a social media KPI scorecard is also invaluable for any SMM department that holds weekly or monthly meetings and discusses how has their online content performed and what needs to be improved in the future.
Marketing budget and budget execution
Marketing project management

This marketing dashboard template emphasizes the power of high-level metrics created for a Chief Marketing Officer (CMO). Marketing executives often don’t have time to research, looking into every detail or monitor low-level KPIs such as the CTR of a display campaign. They need to stay on top of the marketing insights needed to ensure stable progress. That’s where a CMO dashboard creates opportunities, and we will explain this in detail.
The CMO dashboard template we have created is designed to give marketing executives an overview if they will reach the goals of the current month. Please open the CMO dashboard in full screen to see all details. On the top you see 4 number-charts showing the current revenue, costs, net income, and net income per customer for the first 22 days of this month. Additionally, you get a detailed status of your marketing funnel by showing the current number of users, leads, MQLs (marketing qualified leads), SQLs (sales qualified leads) and customers. For every key performance indicator example, you can see the performance in comparison to the last month as well as to the set monthly goal. In this example, we have set a 10% increase in the number of leads as our target, but with the current performance, we will likely miss it by 6%. On the other hand, we can see, that our current performance is 4% better in comparison to the same period of the last month.
Afterwards, we depict these metrics into even more detail, expressing the costs and net income for the mentioned KPIs over time. Each metric shows us the comparison with the last month. We can see the total costs and a visual of each day showing the monthly trends in an area chart also depicting the net income.
This is one of the best marketing dashboards for c-level management that needs to monitor the strategic outcomes of high-level marketing metrics, control customer costs, and see whether their quality of generated leads is corresponding with their sales goals. By taking advantage of automated marketing reports and this professional CMO dashboard, companies and agencies can upscale their marketing performance with ease..
Monitoring technical performance in each offline and / or online channel
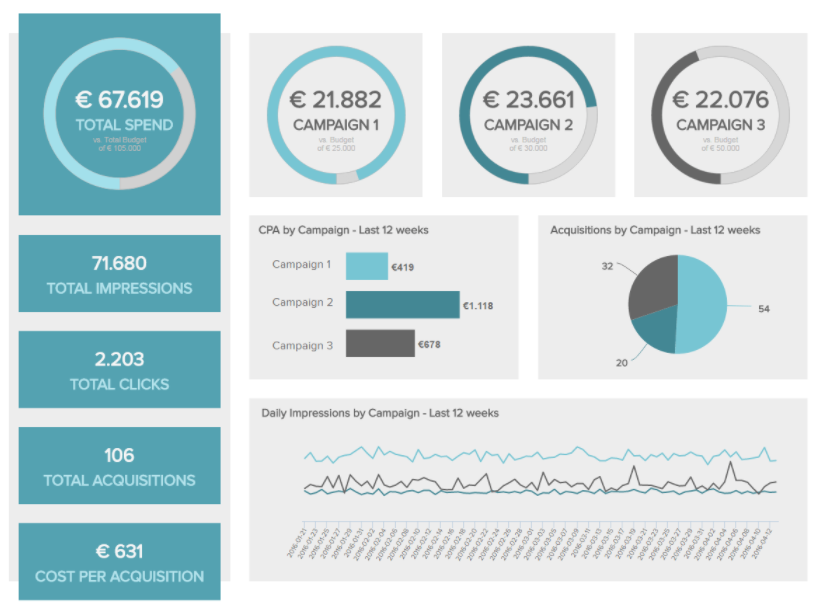
This marketing dashboard template provides a perfect overview of all your marketing performance data across all your different marketing channels and campaigns. The important question is: how much are we spending and what had we planned for this campaign? Therefore, our marketing reporting dashboard starts by measuring your total costs vs planned costs which compares if your costs goals are actually in line with what is feasible. Briefly, you can see if you are on target to meet your marketing budgets for every single campaign. The total number of impressions, clicks, acquisitions, and costs provide an even more detailed overview of your marketing performance data, enabling you to interact with each part of this marketing reporting dashboard and generate valuable insights. This makes planning and executing marketing goals much easier.
The marketing campaign performance dashboard then looks at the click-through rate (CTR) of your paid search campaigns. This is the connecting step between getting the customer to notice you and click on your advertisement. It makes sense to compare the CTRs for each campaign or ad group and track the rate for each country you are advertising in, even in similar countries you can see huge differences when it comes to what works and what doesn’t.
Next up on the dashboard we look at the cost per click or CPC, which can also be monitored by campaigns (please open the full-screen link to see all KPIs). This is also extremely useful for marketing and advertising agencies that handle multiple accounts and campaigns at once and need to know where their dollars have been spent and what kind of results they’ve generated. It is crucial for business success to have actionable data in an easy to comprehend way. This is exactly what our marketing campaign dashboard focuses on.
Finally, the marketing performance dashboard looks at cost per acquisition (CPA) which is often considered the most important KPI in this dashboard. Having an answer to the question ‘How much are we spending for a new customer?’ depends on having this KPI presented to you in a simple and customizable way. You want to be able to look at CPA for each campaign or channel? No problem. Additionally, our marketing performance dashboard provides you with an overview of the overall CPA in the bottom left-hand corner. This marketing dashboard template shows all the data you need to strategically decide where to put your valuable marketing money to be able to maximize all your results.
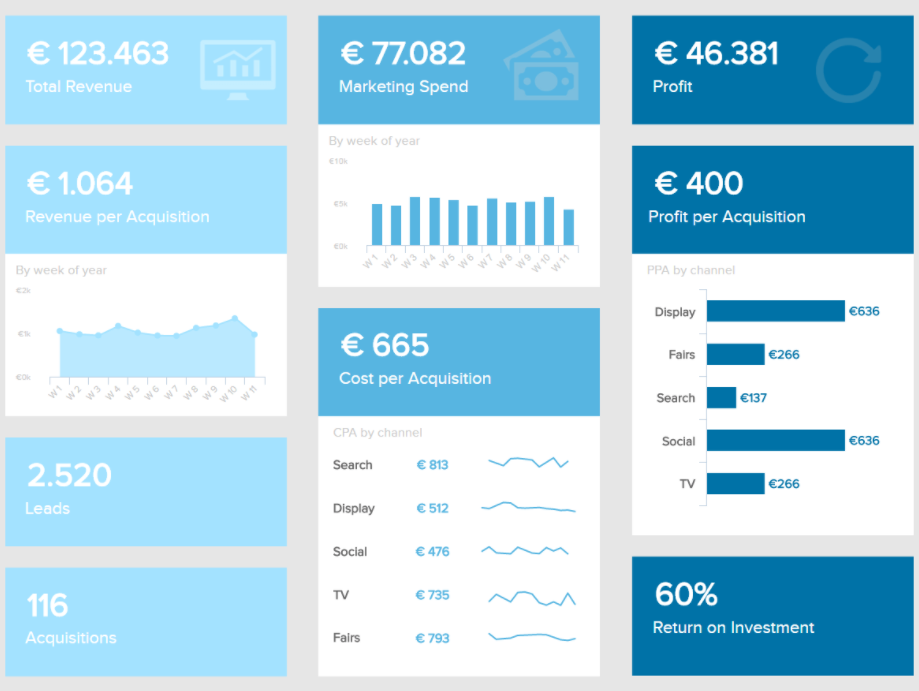
The marketing KPI dashboard provides you with a quick overview of the most important marketing KPIs, which are of course cost and revenue stats. We know that these are the metrics that matter most to your bottom line and will, therefore, receive a lot of attention. This is the reason we designed this dashboard to be as clean and easily viewable as possible. Be aware though that while it is great to improve on the number of sessions and increase the CTR, these changes don’t always lead to more profit or a higher return on investment (ROI). So, while the marketing KPI dashboard provides a useful summary of cost and revenue stats, sometimes it can pay off to dig a little deeper.
You need to present the marketing results to your CEO or investors? This is where our marketing dashboard example excels. Typically, your CEO and investors are interested in the big picture, the bottom line and strategic decisions that advance the business. This is exactly what our marketing KPI dashboard does for you. It aggregates all the relevant cost and revenue statistics in one place, so you can easily relate the revenue to the marketing efforts from a single point of access.
The dashboard starts off by looking at costs per acquisition, which is the amount it costs to gain a new customer. Of course, you want to know which campaigns are acquiring the most customers at the lowest price, so it is useful to look at CPA across all campaigns and channels to see how you can bring on the most customers at the lowest cost possible. If you notice in your marketing campaign performance dashboard (our second example) that your social media efforts bring the lowest cost per acquisition, and the highest profit, it makes sense to invest more in your social media marketing and see which tactics you can implement in other channels as well. These data can also be analyzed by the week of the year, so you can easily spot if you must adjust to seasonal peaks if your users perform desired actions in specific periods of the year.
It also aggregates the revenue and profit per acquisition to measure exactly how much money you are making per customer. Once again, these KPIs are the most useful when you compare different channels or campaigns to determine where your marketing dollars should go in the future. This is the kind of big-picture analysis that your CEO or investors are looking for, and this marketing reports dashboard will provide you with the necessary data and insights you need to outperform expectations.
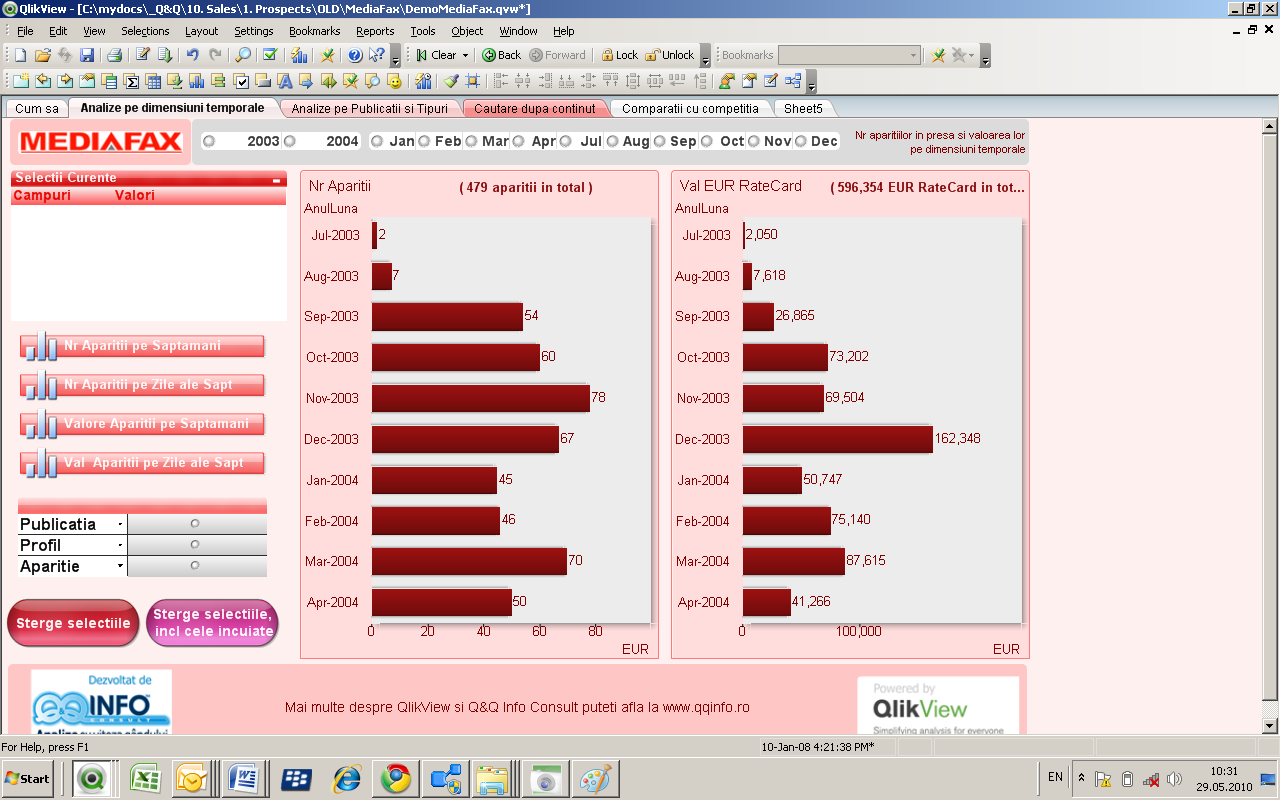
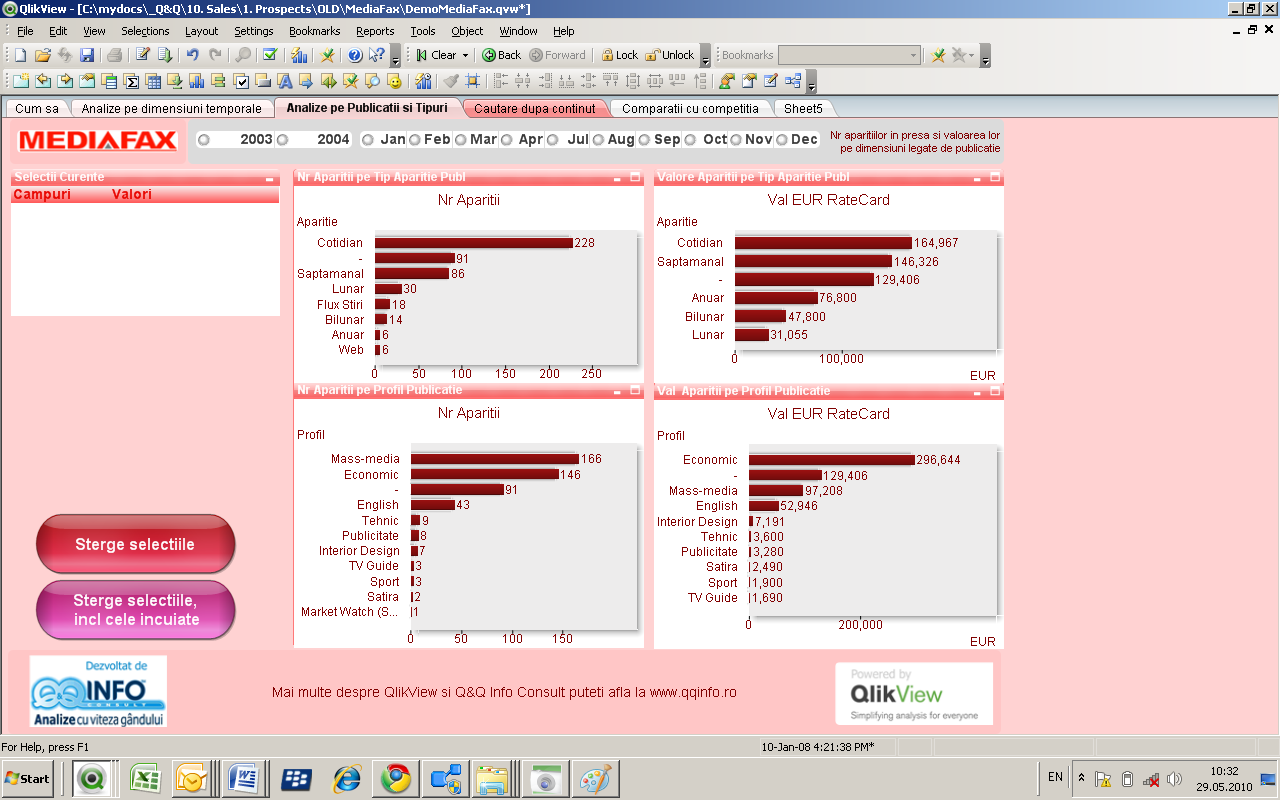
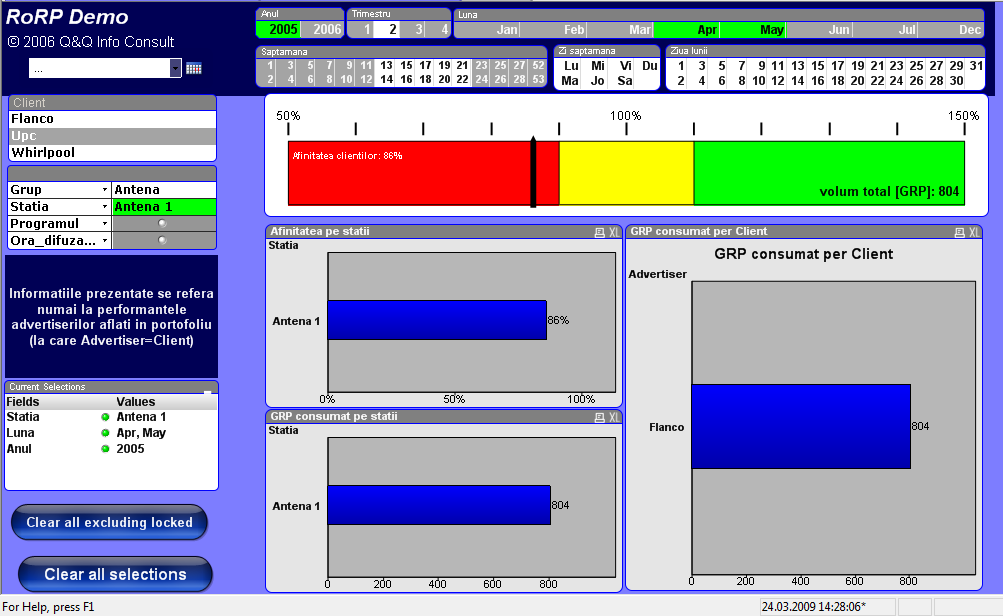
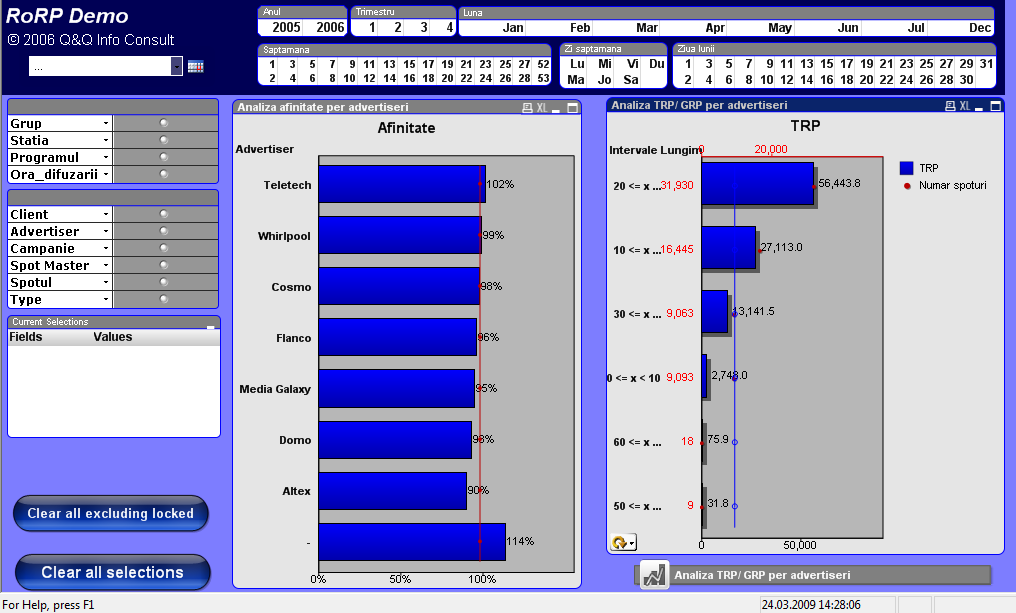
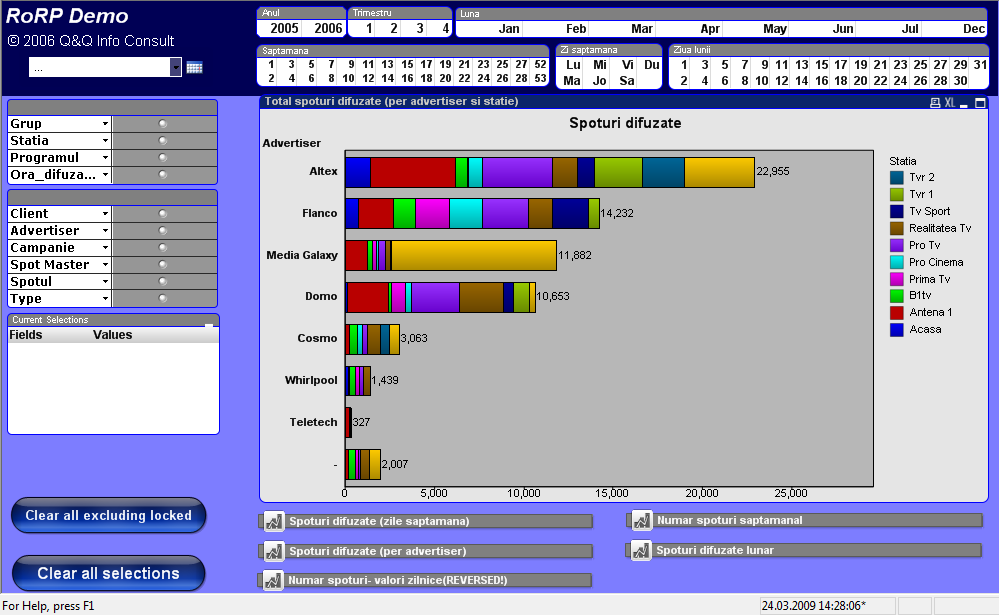
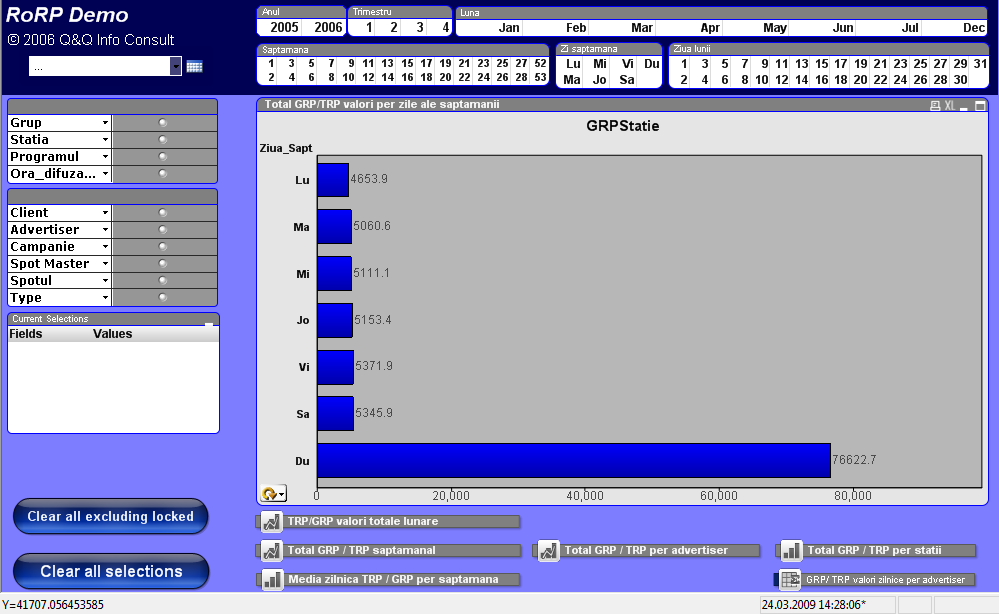
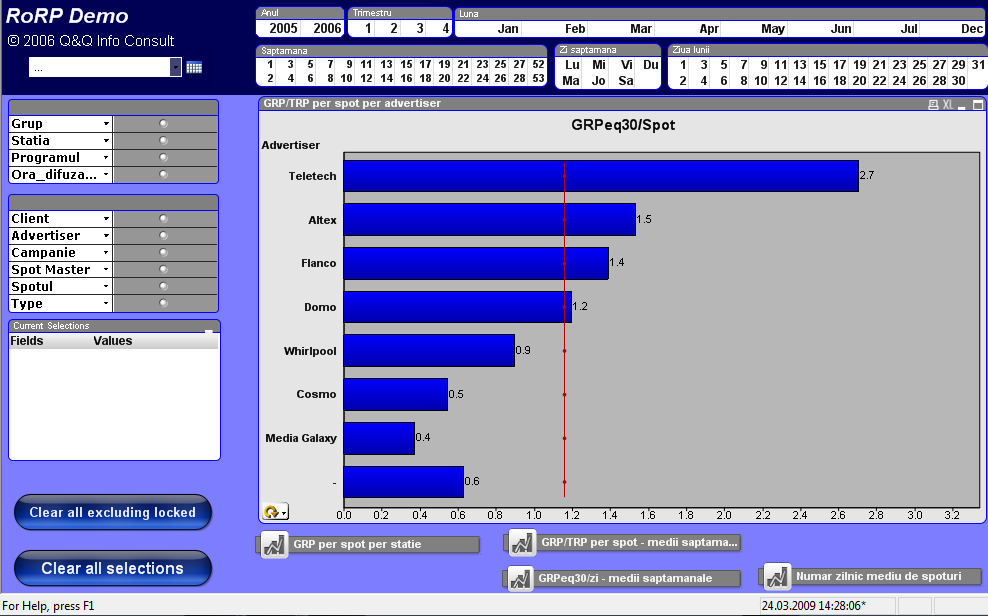
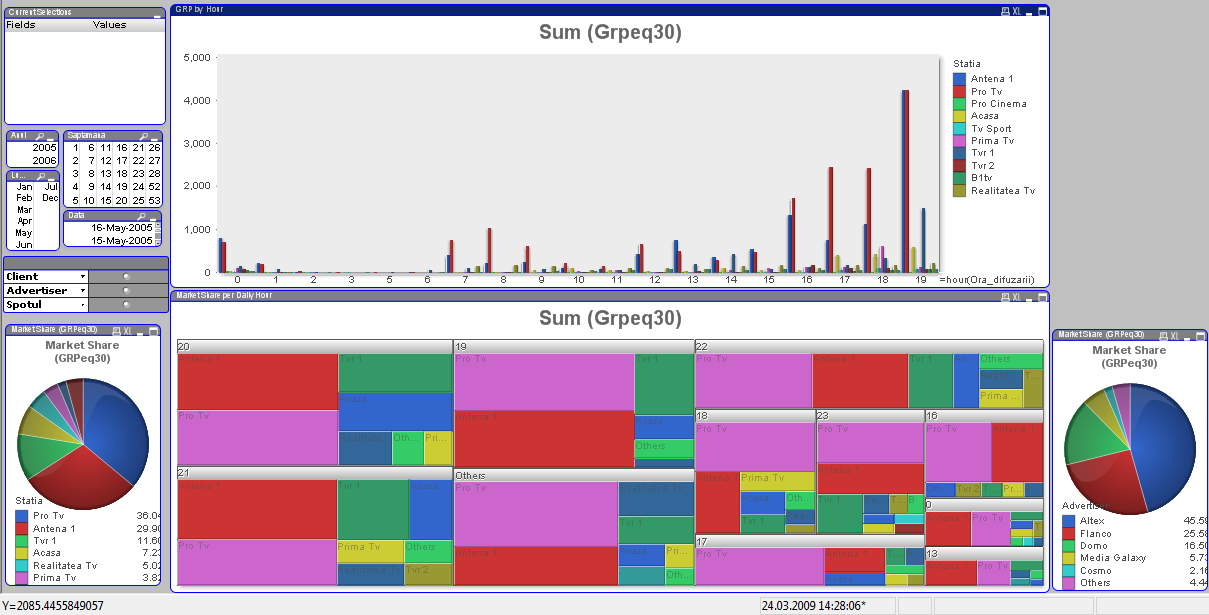
The analysis of TV audiences, press releases and the equivalent value of advertising, or internet traffic analysis, are just a few examples.
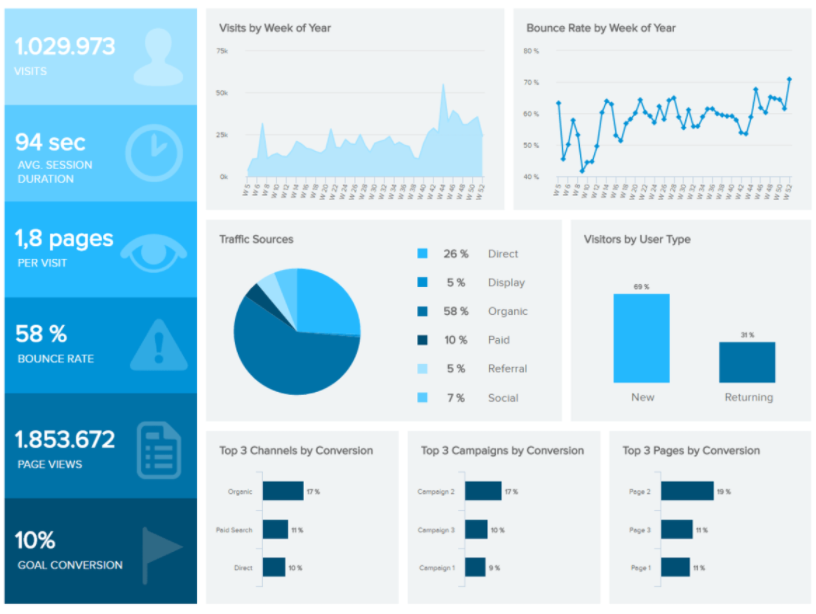
Many companies use Google Analytics (GA) as an easy and affordable way to track visitor behavior on their company website. To gain a deeper understanding of your visitors, tracking is of course just the first step. A well-designed Google Analytics dashboard will give you an ideal overview of your all your major website KPIs.
The web analytics dashboard allows you to aggregate all tracking information so you can keep an eye on all major analytics with ease. The most basic information such as how many visitors you have over a period, and if they are new or returning can sometimes be the most important. Therefore, this data is highly visible, and we made it easy to see briefly if there have been any major changes. Monitoring your traffic sources probably is the second most used feature of web analytics, so we made it as easy as possible. In this marketing reports dashboard, you can easily see where your traffic is coming from and monitor if you are gaining more visitors by direct traffic, organic means, paid search, display advertisement, referrals, or social media. By monitoring which traffic sources are working the best, you can tailor your time and budget accordingly.
But quantity is not everything. This is the reason our online marketing dashboard example also lets you dive in to track critical KPIs like bounce rate, average visitor session duration, and average pages per session. You want to dig deep and understand your visitors? These metrics enable you to qualify the quality of your traffic and draw conclusions from your data. For example, if your bounce rates are high it signals the dissatisfaction of the user, and lets you know that it is time to reexamine your content and your unique selling proposition (USP).
Ultimately, what you want are conversions. You want your visitors to take a defined action (=conversion), such as signing up for your newsletter, start a free trial or buy your product. We know how important it is to be able to monitor the conversion rates, which is why we made sure our marketing dashboard template lets you monitor them in an instance. A well-designed marketing analytics dashboard provides you with your conversion rates so you can see if your website is meeting your business goals. This is what business is all about, and our marketing analytics dashboard example allows you to compare your conversion rates by channel, campaign or landing page and easily identify the most valuable pages and sections on your site.
Correlation of technical communication performance with commercial impact
Managementul Persoanelor
All the famous marketing books of the last 2 decades emphasize that we want, as marketers, loyal customers and, if possible, even partisans actively involved in promoting our products.
This is achieved by combining activities focused on these results with consistent and regular measurement of the results obtained (measurement methodologies may differ, with one of the most internationally known being the Net Promoter Score).
But regardless of the effective measurement methodology, monitoring the results, correlating them with the efforts already made and efficiently targeting future efforts require powerful and increasingly sophisticated analysis tools.
An example of such an application can be found here.
Customer segmentation
More details coming soon !
Personalization of offers
More details coming soon !
Marketing Intern
The concept of internal marketing is in fact relevant at the intersection of Personal and Marketing.
To determine the appearance of fans among the company’s customers, it is often necessary for the customer’s contacts with the organization to breathe the same state of enthusiasm, if not an even higher one.
As such, we want the entire staff, especially those in the promotion, sales, delivery, and services, to be super-fans (promoters) of the company in question. And that requires another set of sustained and measured efforts.
(The NPS approach has also migrated to monitoring the mood of staff, as an essential part of the organization’s marketing effort).
Loyalty systems
More details coming soon !
Affiliate systems
More details coming soon !
Process Management
Eliminating obstacles and failures in the process of informing consumers and especially in purchasing is a key factor in the success of a company today.
If we talk about online commerce, the above statement is even more relevant
In this regard, sustained efforts are needed to monitor and improve processes that have an impact on the customer, and each such effort requires monitoring of the current level of performance, evolution over time, the impact of improvement initiatives or comparisons against defined targets.
Some processes are not directly under the control of the marketing department, but even in this case, the measurement of quality and especially the consumer’s perception of the quality of the company’s processes is and will remain in the care of marketing.
Trying to learn from the best ones, we can see quite easily how the top Romanian and international online retailers offer simpler and more pleasant experiences when buying, returning, paying. FRICTIONLESS is the key word. Measuring and monitoring performance and especially customer perception of process performance is a key success factor.
Another example: The contactless payment options of payment card operators have also been a sustained improvement in payment process technology, and now it’s time to pay with your phone or smart watch!
The browsing experiences
More details coming soon !
Buying and paying experience
More details coming soon !
Delivery experience
More details coming soon !
Return experience
More details coming soon !
Physical Presence Management
- Even though people often consider themselves rational beings, there is ample evidence that confirms the importance of feelings, including those directly related to the senses, as being essential in our purchasing decisions.
There is a lot of market research on sensations, senses, and their correlation with trading results.
All are extremely important in creating a shopping experience:
- The smell
- Ambiental music
- Color palette
- Tactile sensations
Hence, increasingly complex needs to monitor the reality, perception, and impact of consumers’ physical sensations.
Beyond the marketing mix
The strategic as well as operational importance of marketing can be supported by pillars of powerful analytics and business intelligence in many ways, of which we have highlighted just a few below.
Direct Marketing
Direct campaign management involves not only analyzing specific results, but also understanding performance in a broader context of all campaigns and integrating information related to downstream results.
More details coming soon !
Strategic Marketing
Defining and choosing the markets of interest has as an important component the starting point, customer segmentation, but the analysis of the market potential is already quite well in the strategy area.
An interesting example can be found here.
More details coming soon !
Integrated analysis tools
Beyond the need for the availability of all these analytical tools, an important aspect that deserves to be emphasized in conclusion, is the growing need to integrate all these analytical and decision-making tools.
And we refer here to the integration of the above components between them, under a small number of analytical packages, as well as their integration with analysis tools and decision support, necessary in other areas, especially in the operational and commercial area (example of Marketing 360 analysis here).
The use of disparate analytical tools for all analytics and the tools contained in this article, even if already fully available, would lead to significant downtime, for retrieving analysis contexts and applying context filters, necessary for each instance of analysis.
Some ideas and pictures were taken from the following source: https://www.datapine.com/dashboard-examples-and-templates/marketing.
For information about Qlik™, please visit this site: qlik.com.
For specific and specialized solutions from QQinfo, please visit this page: QQsolutions.
In order to be in touch with the latest news in the field, unique solutions explained, but also with our personal perspectives regarding the world of management, data and analytics, we recommend the QQblog !