There are myriad different data sources out there, and it is possible to load any of them into Qlik™. Some are easier than others, sure, but there is always a way. There are good articles and posts on some of the trickier sources, but today we want to show you how you can bring in CSV data from GitHub. This means you can pull up to date, crowdsourced and governed data directly into your applications, just by following these simple steps.
Introducing The CSV Data
Here below, we will present a recent project, called Data On The Earth, as an initiative to get data that can help everyone, from policy makers to concerned individuals, make more informed decisions about environmental issues.
The first thing consisted in some ideas over some data that had relevance for this purpose. The site Our World In Data seemed like a good place to start.
On that site there data which related to CO2 emissions, hosted on GitHub (more about these data here). The data are by Country and Year, so a bit of extra metadata on the countries would allow some demographic filtering. This information was in two further CSV files, also conveniently hosted on GitHub.
The data are not perfect, as some of the figures are not reported by all countries in every year and countries change over time.

Creating a Connection
The code in this article is for the load script of Qlik Sense™. You can do similar with the REST connector in QlikView™, but the syntax is a bit different, this post should give you pointers should you wish to build your own load script.
As with any load script in Sense you first need to have your connection created. Rather than create a separate connection for each data source I load I tend to create a generic connection of each type required and modify it using WITH CONNECTION. If you do not have the required connection set up, go to the Data Load Editor and click Create New Connection.
Give your connection the name GenericGET and point it to a placeholder, such as https://jsonplaceholder.typicode.com/posts, ensure the Method is set to GET and leave everything else as defaults.

Click on Test Connection, then Close and finally (if all is good) Create.
Building the Load Script
Now, onto building the load script. First, we need to do some set up, to connect to our connection and set up some variables:
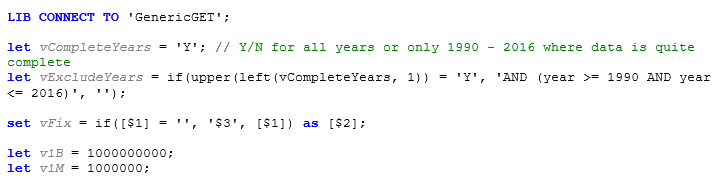
The first variable allows us to turn on or off data for years which are not that complete, the second puts the code to implement that into a variable if switched on. Next, we have a variable which includes parameters that we will use later on. If you have not used them before you should see this post on Using Parameters with Qlik™ Variables. Finally, a couple of variables to remove the risk of typing the wrong number of zeros later.
Now we are set up, we can do the main part of the load.
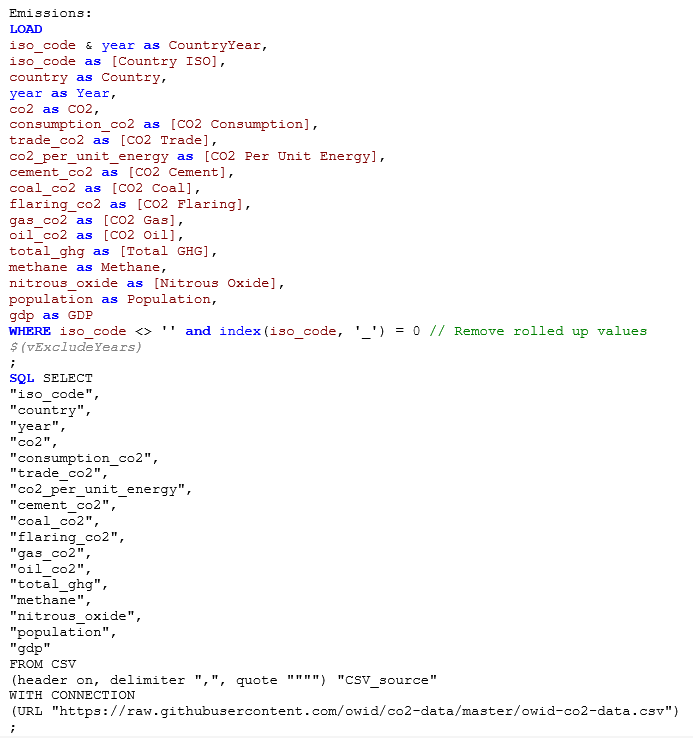
As with a database load this load will use the last opened connection. The CSV on the FROM line is specifying the basic format that we are loading from this connection; the exact format of the CSV is specified in the brackets – just as it would be if you were loading the CSV from a Folder Connection. The CSV_Source relates to which data source at the connection you wish to load – with a CSV this will only ever be CSV_source, but with JSON data there may be many named sets of data for you to choose from. The WITH CONNECTION then defines the URL we are loading from.
To explore these options further create another connection, pointing to that URL and look at the Select Data dialog for that connection.
Atop of the REST load we have a Preceding Load, to tidy the field names and remove data we don’t want. There are rows with data rolled up to regional levels, but we are going to do that ourselves in Qlik™ so need to remove the roll ups to avoid double counting. Note that when doing a WHERE in a preceding load all the data still must come down from the REST source first, so you may want to look if you can pass parameters to the URL you are loading from to drop some data, rather than using a WHERE statement.
So, that is the data we require from our main data source. We are going to continue though, and augment and categorize these data some more.
Bringing in more CSV Data
The next table of data is a simple table of country demographics, provided by GitHub, keyed on the ISO code for the country.
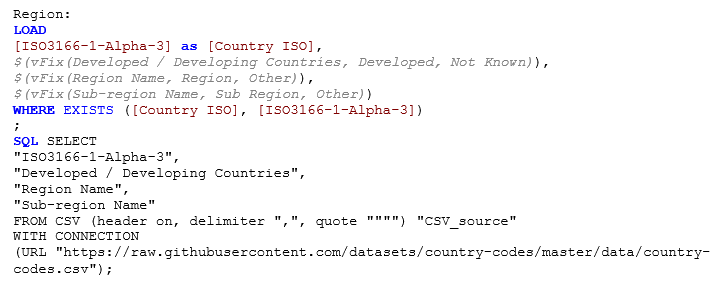
This file has many more columns than we need, but we are cherry picking the few that we want. As you can see, the code for connecting to a CSV source is almost identical to above – just the URL is changing. In the Preceding load the vFix variable we created at the start is being used to replace any missing values with Not Known or Other. A WHERE EXISTS ensures we only get rows which relate to countries we have emissions data for.
Using a lookup table like this from a repository like GitHub in your Qlik™ apps means that your application will benefit from improvements to that dataset over time, rather than having a CSV or Excel spreadsheet languishing on your server which will never see an update.
Where In The World Is That ?
As we are looking at country data it would be great to plot that on a map, and another GitHub source has just that information available for us. These data are provided and maintained by Tadas Tamošauskas in a personal report.
Here we are going to LEFT JOIN the data onto the existing region table, bringing the latitude/longitude data into the same table as the regions. You will see why in a bit.
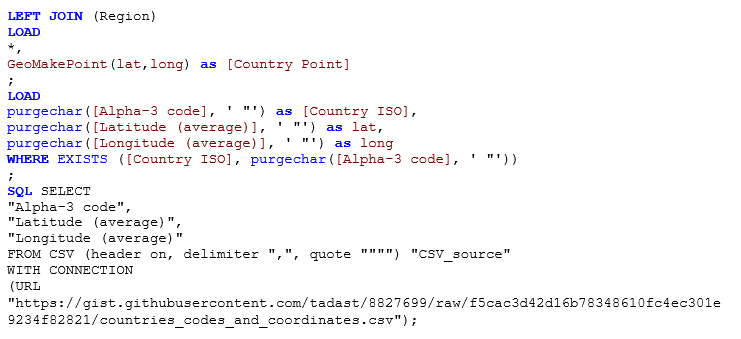
This now lets us plot emissions data on a map by country. Our second data source though gave us Region and Sub Region names. It would be good if we could also plot by those regions. There is probably a data source out there which has SVG data for each region, but that could take a while to find and will not necessarily map to our existing region names.
We can apply a simple hack to generating points at each of the regions though.
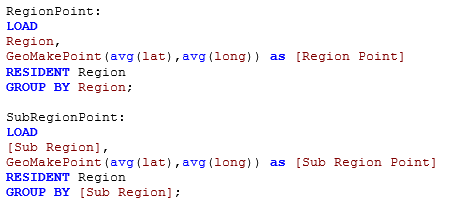
Here, a couple of RESIDENT loads from the existing Region table can be grouped to give one row per Region and Sub Region. For each of these rows the average latitude and average longitude can be calculated. These two values can then be changed to a point that can be easily used on a map. Note that some points may appear in the ocean, but that is the joy of using averages.
Finding Latest Data and Grouping Figures
The figures from our initial dataset are great for trending over time as they are provided on an annual basis. They are not so great for categorical data and providing filters though, as a country could move from one bucket to another year to year. For these filters we only want to use the latest figures. Here we hit another minor snag though, in that the last year in which data is available differs by country.
We can deal with this by finding the latest year for each country, using a RESIDENT, GROUP BY and MAX to create a composite key.

That composite key can then be used in the WHERE EXISTS of a subsequent RESIDENT load to only bring the latest data.
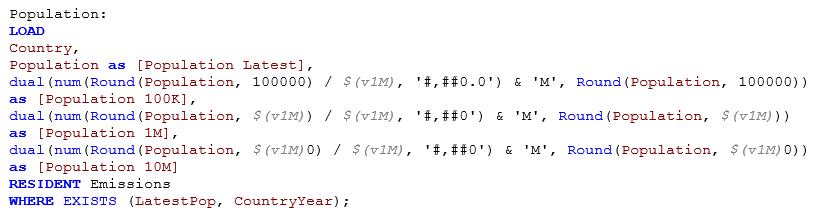
This is a useful technique, and one I use frequently in live projects. As well as getting the exact number for the latest year for each country we can also put things into buckets. This can be done with a massive IF statement or for equal buckets an aggregation. Here I have used a Round statement, but you could use a Floor or Ceil if you prefer. The Round function in Qlik ™is more flexible than in most languages as, rather than just rounding to a number of decimal places, you can specify what grouping you wish to go to, whether that is more or less than one.
The same technique can then be used for GDP, then there is just a little bit of housekeeping to do at the end of our script.

So, that is it. Put all those bits of script together and you should have a working load script to bring in emissions and demographic data from three separate online CSV sources.
Now you just need a quick way to analyze those data. Fortunately, we have your back there.
Viewing The Data In The Instant Sense Application
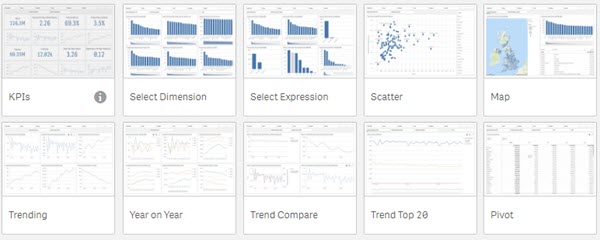
To make it quick for us at Quick Intelligence to produce Proof Of Concepts for potential clients I created the Instant Sense Application. This application allows you to load any data source, and a spreadsheet of metadata about that data source, and then explore the data over twelve sheets of user configurable visualizations and tables.
Article source: https://www.quickintelligence.co.uk/load-online-csv-into-qlik/.
For information about Qlik™, please visit this site: qlik.com.
For specific and specialized solutions from QQinfo, please visit this page: QQsolutions.
In order to be in touch with the latest news in the field, unique solutions explained, but also with our personal perspectives regarding the world of management, data and analytics, we recommend the QQblog !