Every manager wants to have both an overview and details on the workload (in hours or days) of each employee, but without taking into account the staff downtime.
Usually, the first such human resources analyses focus on the information extracted from timekeeping, thus covering the attendance of staff at work.Equally relevant are planning PTO (paid time off) analyses and analyses used to highlight the impact of time breaks on the actual volume of hours available.
The QQinfo team has a rich experience in implementing visual analysis solutions for management with the help of Qlik™’s Business Intelligence platform, that’s why it is at your disposal with customized analyses on any company’s needs.
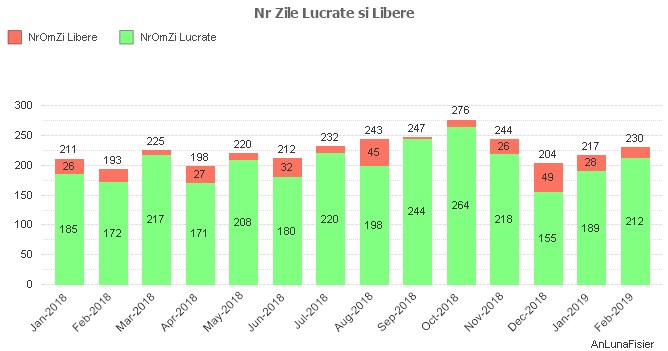
The next analysis shows an evolution of the number of days worked and days off, and with the help of external filters you can focus on a time frame or you can highlight the details at another level of temporal clusters.
The image analyzes the January 2018-February 2019 period.
The days worked are represented in green, and the days off in red. However, what should be noted is that in July, despite expectations, very few days off were recorded, compared to June.
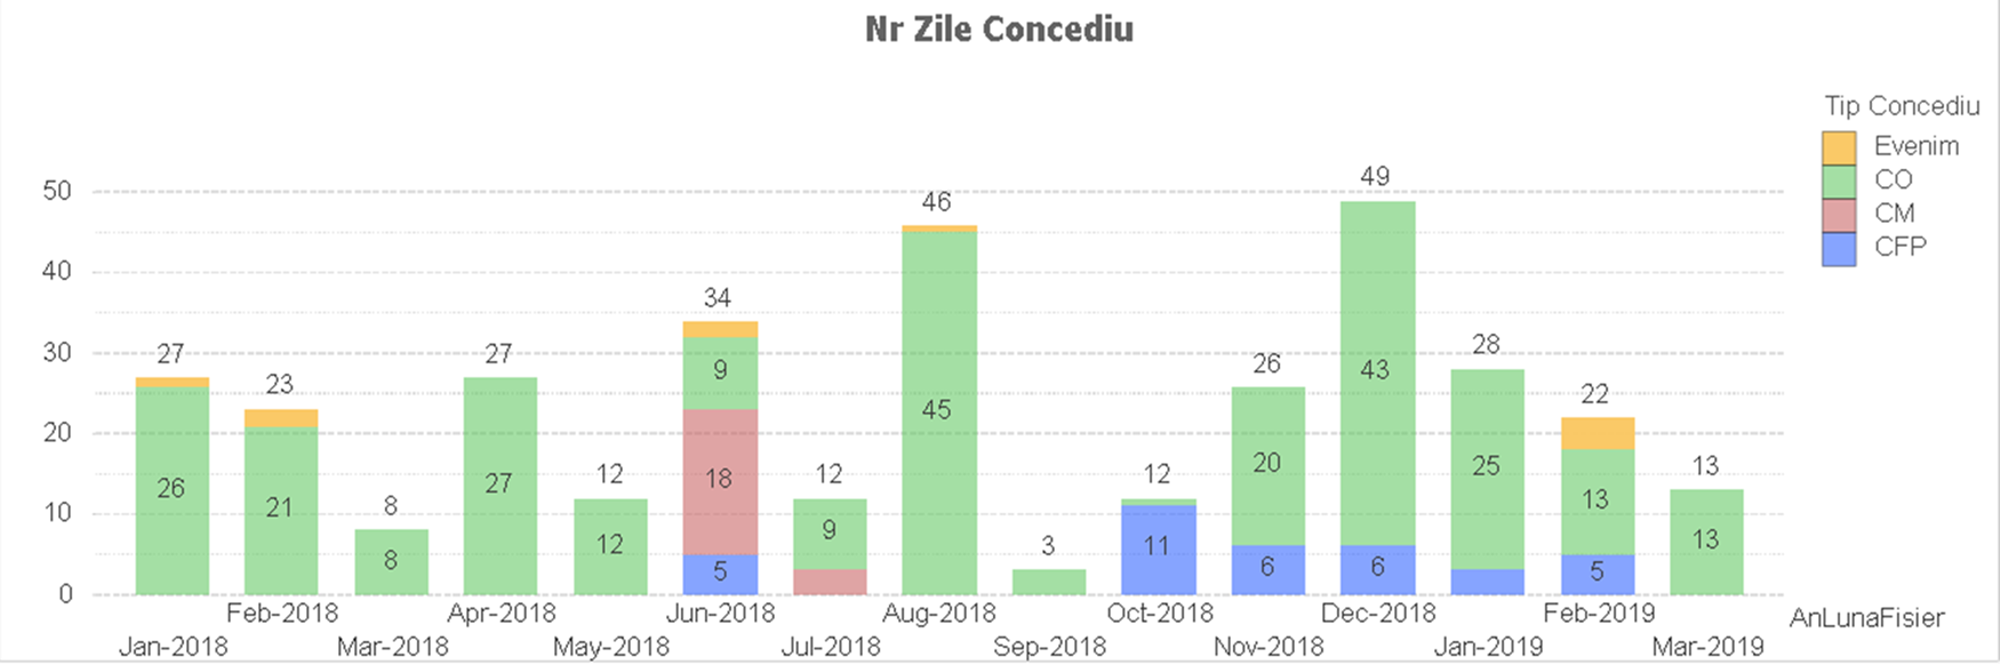
Reports that centralize employees PTO are also very relevant for HR analyses especially when the analysis details the type of leave.
For a better understanding of the data, a distinct coloring was used: green for rest leave, red for medical leave, blue for unpaid leave, and special events are represented with orange (e.g.weddings, funerals). In our example, we can understand more precisely what is the source of the increase in the number of days of June leave, sick leave and unpaid leave.
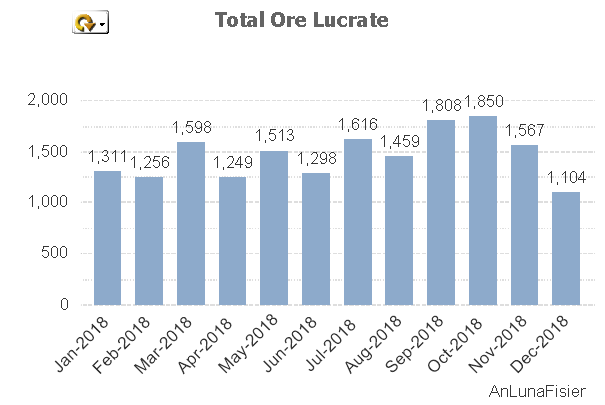
There are situations in which the analysis is no longer done at day level, but at the level of hours worked:
The Bar Chart shows an evolution of time (over 1 year period) of the number of hours worked, in total and by department.
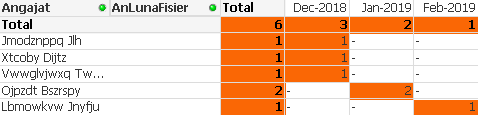
Managerial analysis systems often face the problem of insufficient quality of recorded data, and therefore there is a need to monitor not only the information, but also its quality.The example below analyzes missing or incomplete timesheets (with missing timesheets on arrival or departure).
The graph directly highlights the 5 employees who have days off between December 2018 – February 2019.
The total number of unregistered(or incompletely registered) days is different in the analyzed period: the first employee has only one unregistered day, the second employee also has one single unregistered day, in December and so on.
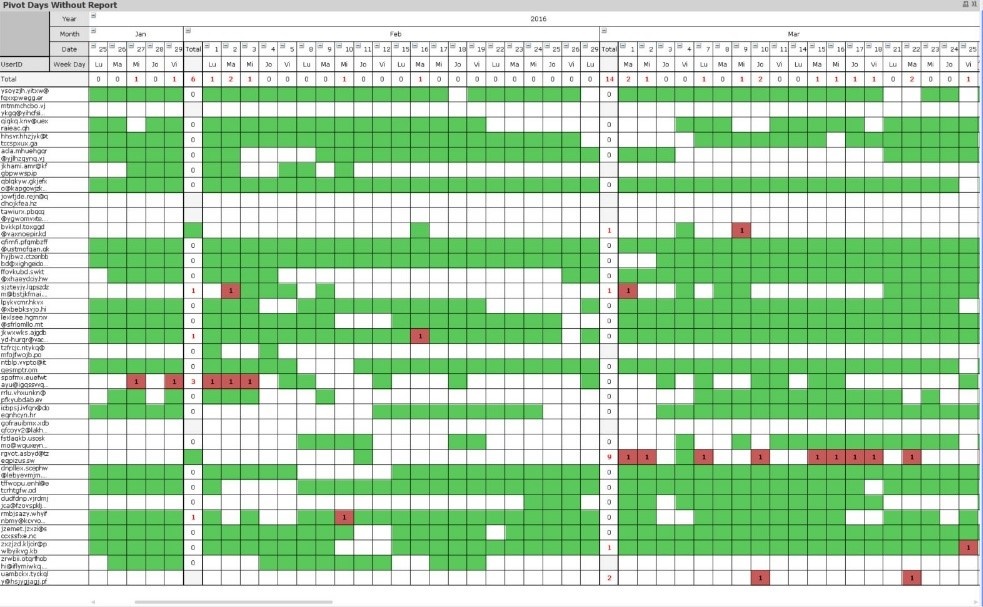
When a more detailed perspective is needed, in which exceptions are no longer highlighted, one can usethis suggested visualization:
The unregistered working daysare highlighted in red, and the working days in which the registration exists and is coherent and consistent are highlighted in green.
These are just some of the HR analyses that the QQinfo team has developed and that can adapt to the needs of each company.If you are interested and want more details, do not hesitate to contact us at office@qqinfo.ro.
For Qlik™ information, please click here: qlik.com.
For QQinfo solutions, please visit this page: QQsolutions.
This website uses cookies to improve your experience. We'll assume you're ok with this, but you can opt-out if you wish.AcceptRejectRead More
Privacy & Cookies Policy
Privacy Overview
This website uses cookies to improve your experience while you navigate through the website. Out of these, the cookies that are categorized as necessary are stored on your browser as they are essential for the working of basic functionalities of the website. We also use third-party cookies that help us analyze and understand how you use this website. These cookies will be stored in your browser only with your consent. You also have the option to opt-out of these cookies. But opting out of some of these cookies may affect your browsing experience.
Necessary cookies are absolutely essential for the website to function properly. This category only includes cookies that ensures basic functionalities and security features of the website. These cookies do not store any personal information.
Any cookies that may not be particularly necessary for the website to function and is used specifically to collect user personal data via analytics, ads, other embedded contents are termed as non-necessary cookies. It is mandatory to procure user consent prior to running these cookies on your website.