In the last 3 weeks we have had 2 groups of Cybernetics (ASE) students in internship at QQinfo. One of these groups focused on the development in Qlik™ of a set of visual analyses about the expenses of the Romanian local administration in recent years.
Here are some of our common results and findings, obtained within 2 weeks of their first steps in Qlik™.
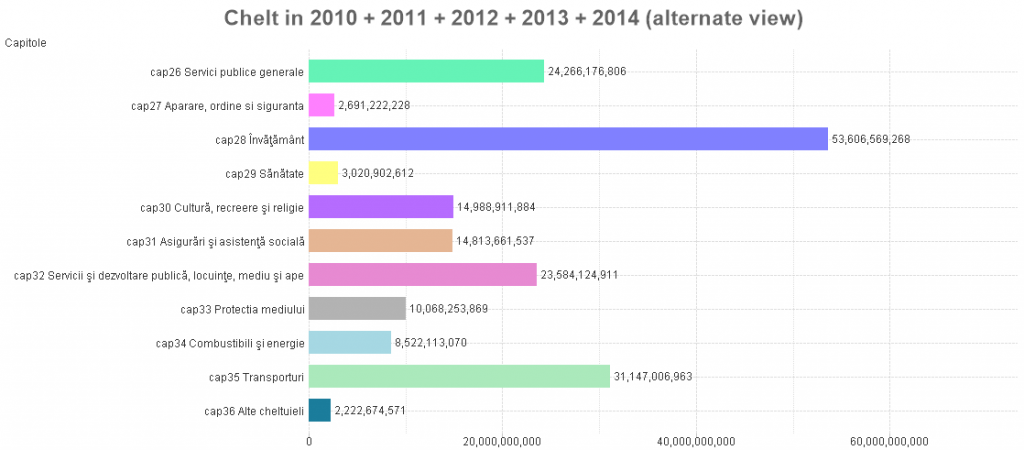
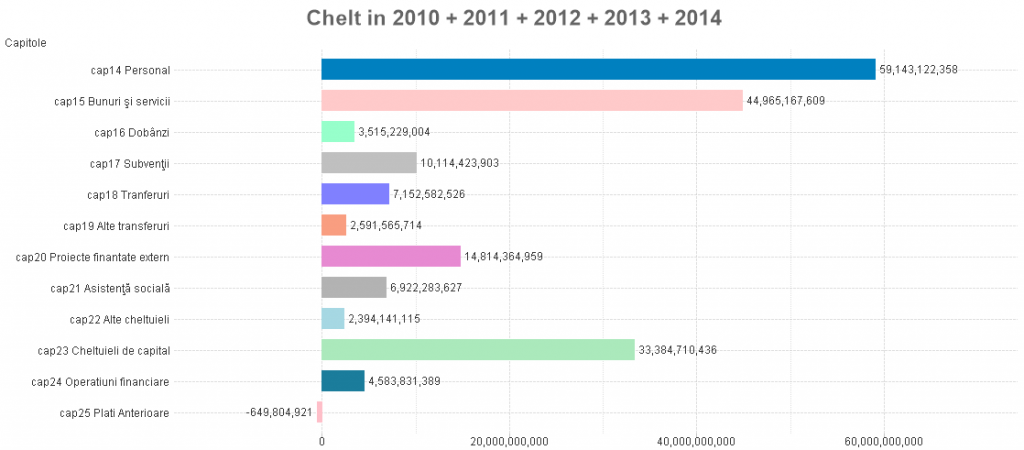
1. Distribution of the cumullated expenses of all Romanian local administrations.
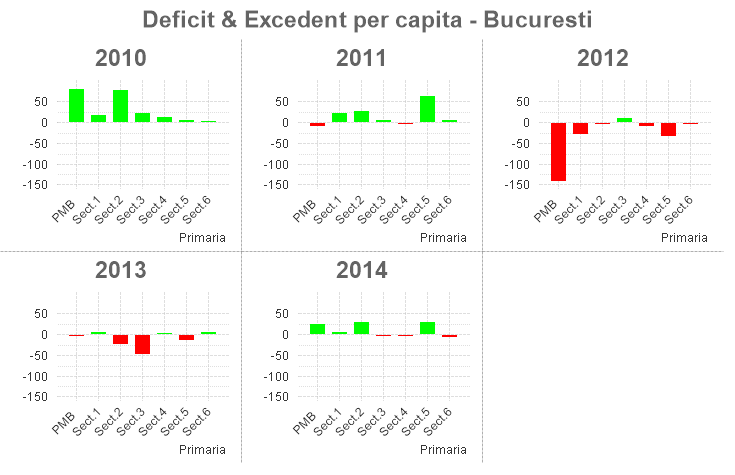
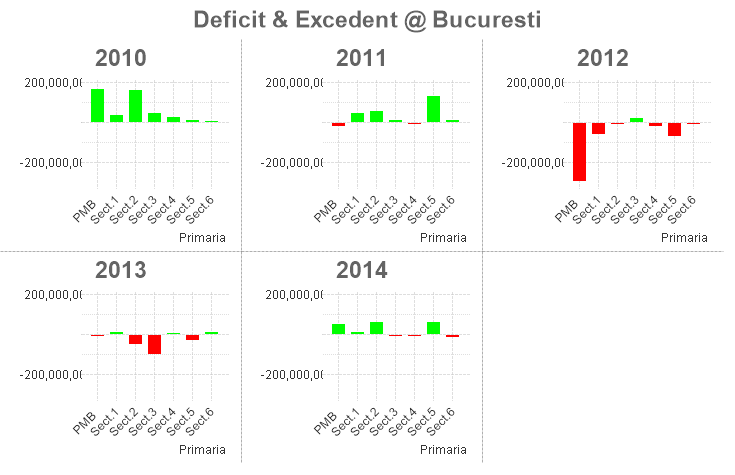
2. European funding has been absorbed in a completely different way by the districts of Bucharest.

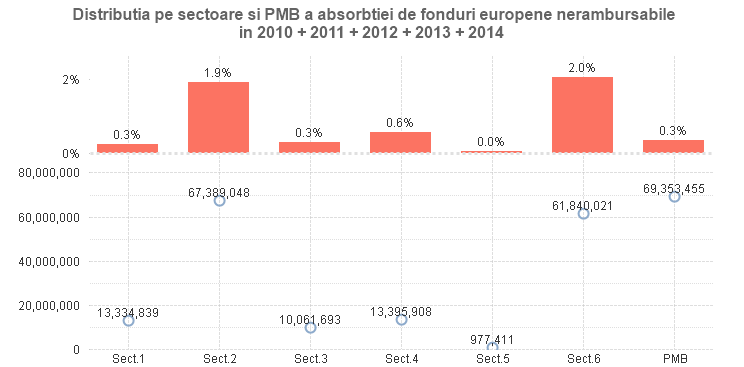
Correlating this with per capita income, but also with the absolute values, one can notice a counter – performance in District 5 and PMB, at least, and a positive performance in Districts 2 and 6.
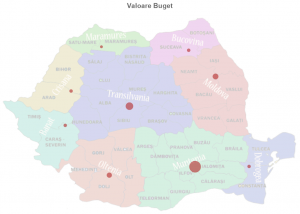
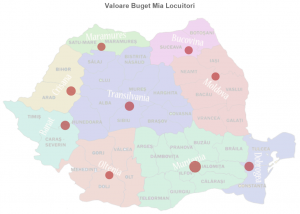
Returning to a national perspective, here is a breakdown by budget and per capita budget by region:
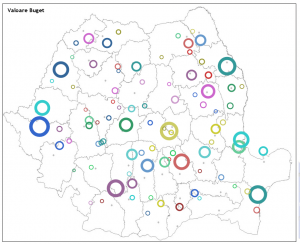
But also the top budget (and per capita) for Romanian municipalities (Bucharest and districts were excluded).

If you are interested in using the published information further, you can take it over, specifying the sources: (www.banipublici.ro and www.QQinfo.ro)
And if you need an in-depth analysis of this kind of information, the results of collaboration with our students have been generated dozens of views, which turn into thousands of analyses through selections (this in only 2 weeks of testing!), of which only a small part has reached this article.
In case of significant interest, we will look for solutions to publish the entire information package, including a broader historical perspective.
Thanks for the involvement of those 5 students (Andreea Tănase, Ioana Cirstian, Lavinia Simion, Natalia Petrian and Jumanazar Gurbanov), but also to the teachers from ASE who offered us the opportunity to meet and interact with them.
Thanks to Cătălin P. for the idea and for directing to the main data sources used and thanks to Florentina Dogaru, for the guidance given to the student team.
Notes:
- Data sourse used: www.banipublici.ro.
We welcome the initiative ! - Population information used in per capita reports has been used , at least in part, since the census in 2002, not since 2012 !
- The information presented was not confirmed from several sources, fully validated. We also specify that the validation process of the processing was partial.
- We have no political affiliation (neither for nor against) !
For information about Qlik™, please visit this site: qlik.com.
For QQinfo solutions, please visit this page QQsolutions.
