
The Factorial Analysis, or cause-effect analysis, allows the identification of the contribution of each of the determinants of the variation of a compound KPI, in the variation of this KPI.
We cannot point out enough how important this analysis is and how little it is used today, because it allows us to quickly understand the cumulative impact of our multiple punctual day-to-day actions, and individual market reactions, upstream and downstream.
Example: We want to know what variations (between the current year and the same period last year) determined, in the net commercial margin, each of the following factors:
- Average Unit Purchase Price
- Quantity Sold
- % Markup (Percentage of Margin at List Price)
- % Discount (Percentage Trade Discount Granted during negotiations)
- % Disc Card (Percentage discount granted in the loyalty program)
- % Bonus (Off-invoice percentage bonus offered by suppliers)
- Expanding the product portfolio
- Narrowing the product portfolio
The analysis is the more relevant when the mentioned factors are under the influence of different managers within the company (supply, marketing, sales, etc.).

The combination of factorial analysis with waterfall highlights the gradually cumulative contribution of each factor, as a plus (green) or a minus (red) in the final result highlighted to the right of the graph.
The example on the left highlights the major positive impact of a change in price policy (a significant decrease of the margin at the list price) which, however, led to a volume increase that compensated and rewarded the decision to change the margin.
Remarks:
1. As suggested in the upper area of the image above, our factor analysis engine allows the user to choose, directly from the interface, several variants of factor calculation:
- of the temporal perspective of comparative analysis (YTD vs LYTD, MTD vs LMTD, MTD vs LY MTD, etc.)
- of the composite indicator set + influencing factors (Margin with 6 + 2 factors, or sale with 4 + 2 factors, etc.)
- of the granularity of the analysis (Article, Article-customer combinations, etc.)
2. For us it is implicit, but it is worth making explicit that this analysis is available every day or whenever the data is refreshed, automatically, in all options determined by the above-mentioned analysis contexts, both for the current situation and at any previous date (roll-back option).
3. In addition, it is worth noting that this analysis uses in the calculations all the details, at transaction line level, of the history of the chosen compared periods, being able to request both the general calculation, on all data, and any filtering variant on all sizes available in the dataset.
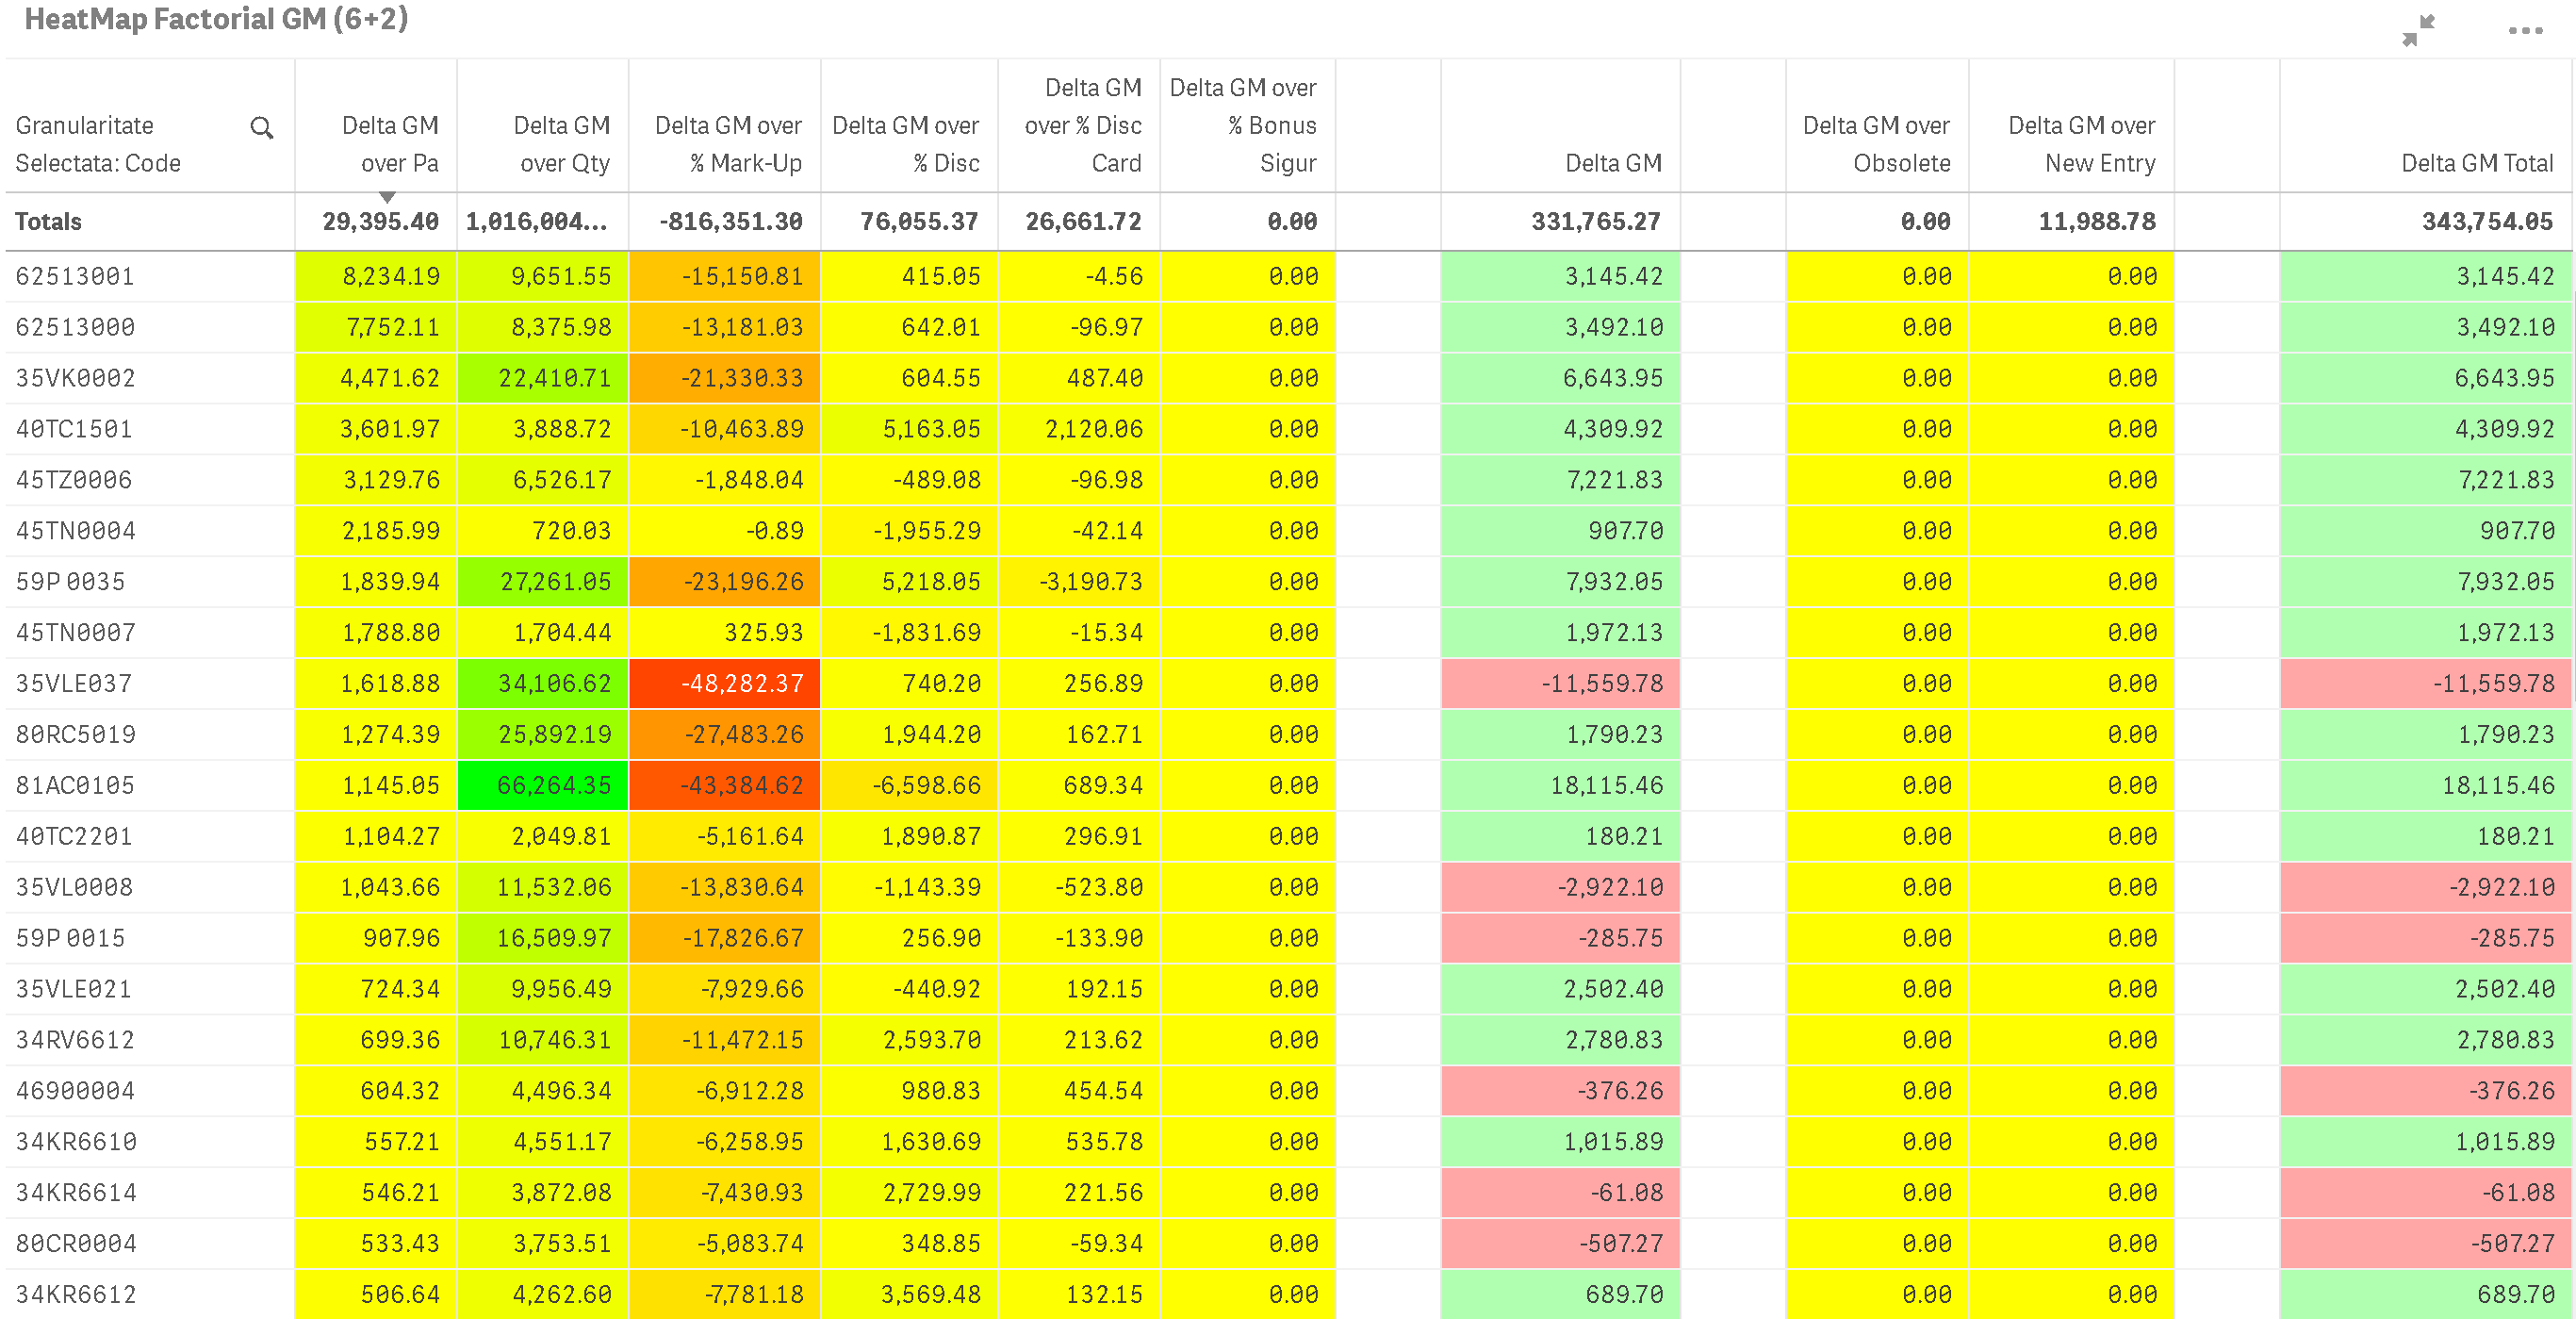
To facilitate and comparatively analyze the impact of factors at levels of detail, we use a tabular view of Heat-Map (temperature map), which can quickly identify, from the intensity of the color viewed at high granularity levels, which are the maximum points influence (simultaneously identifying the specific articles and factors you are looking for, as in the example on the right).
Yellow represents relatively small values, close to zero, while very positive (green) or very negative (red) values stand out immediately.
In combination with the heatmap, a bipolar +/- signaling with other shades of green and red is used for the summary columns.
The starting data set required to be able to implement such analytics is usually relatively simple to obtain/ extract from ERP and this means that the costs associated with the implementation of such a set of analytics will also be low.
Beyond the analyzes presented, one can go even further, providing a factorial analysis of net profitability, influenced by a huge number of factors, such as, beyond the factors of income and margin:
- number of customers,
- number of issued documents,
- average unit productivity indicators,
- number of employees,
- average salary,
- etc.
Factorial analysis (cause – effect) has been taught in economic and computer science faculties for a long time, including in our country, but the implementation of such analytics, especially at such a level of flexibility, is practically a world premiere, possible only in the context of the processing power offered by Qlik™ and the innovation approach by the QQinfo Team, which always makes it available to our beneficiaries.
For QQinfo solutions, please visit this page: QQsolutions.
For information about Qlik™, please visit this: qlik.com
If you want a quick implementation of factorial analysis in your company, please let us know by filling out the form here !
In order to be in touch with the latest news in the field, unique solutions explained, but also with our personal perspectives regarding the world of management, data and analytics, we recommend the QQblog !