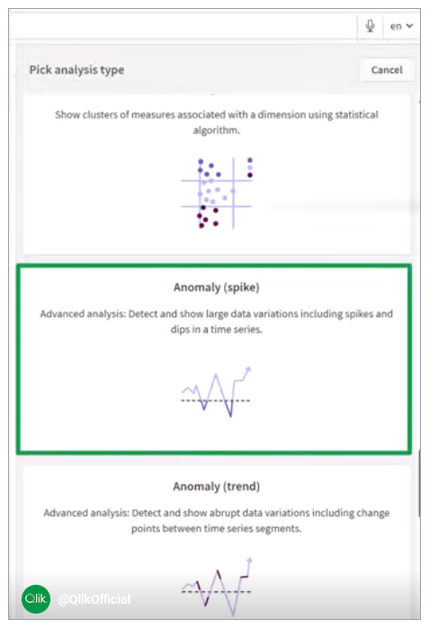
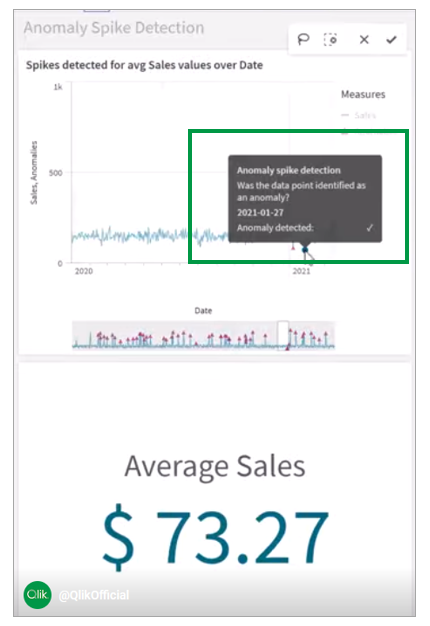
Do you think you are catching all the spikes in your data? Think again! With Qlik’s Anomaly (Spike) analysis type, you don’t just see the obvious — you uncover the hidden outliers buried deep in your data.
You can see big spikes on the chart, but are you seeing all of them?
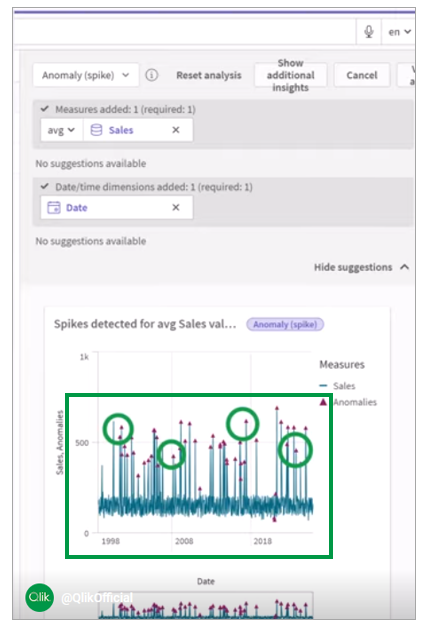
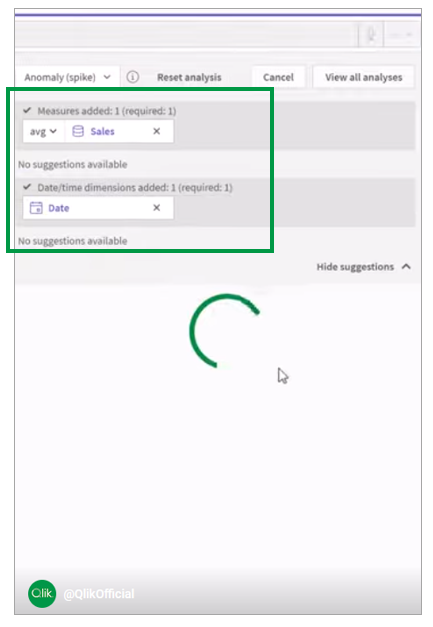
With Qlik it’s simple. Just choose your measure and type field and Qlik instantly highlights the real anomalies, not just the obvious ones but even the hidden outliers you’d miss, scanning thousands of rows.
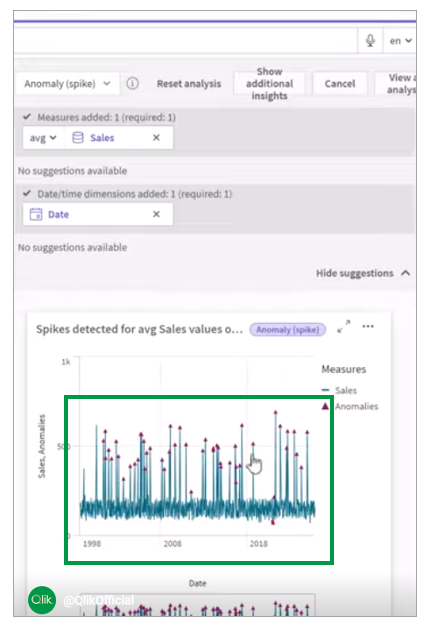
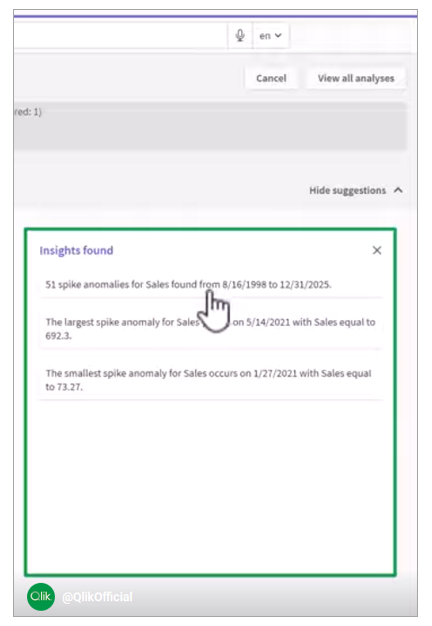
Qlik can capture that, and the best part, you get instant insights about total anomalies, biggest spike, smallest drop, all laid out for you. This is fast, smart and with no guesswork! Just instant, actionable insight.
For information about Qlik™, click here: qlik.com. For specific and specialized solutions from QQinfo, click here: QQsolutions. In order to be in touch with the latest news in the field, unique solutions explained, but also with our personal perspectives regarding the world of management, data and analytics, click here: QQblog !
This website uses cookies to improve your experience. We'll assume you're ok with this, but you can opt-out if you wish.AcceptRejectRead More
Privacy & Cookies Policy
Privacy Overview
This website uses cookies to improve your experience while you navigate through the website. Out of these, the cookies that are categorized as necessary are stored on your browser as they are essential for the working of basic functionalities of the website. We also use third-party cookies that help us analyze and understand how you use this website. These cookies will be stored in your browser only with your consent. You also have the option to opt-out of these cookies. But opting out of some of these cookies may affect your browsing experience.
Necessary cookies are absolutely essential for the website to function properly. This category only includes cookies that ensures basic functionalities and security features of the website. These cookies do not store any personal information.
Any cookies that may not be particularly necessary for the website to function and is used specifically to collect user personal data via analytics, ads, other embedded contents are termed as non-necessary cookies. It is mandatory to procure user consent prior to running these cookies on your website.