Now you can take advantage of features previously released Qlik™ Cloud, which are also available in Client-Managed. Our newest release of Qlik Sense™ includes expanded Augmented Analytics capabilities, new visualizations, and added connectivity.
Visualizations & Dashboards
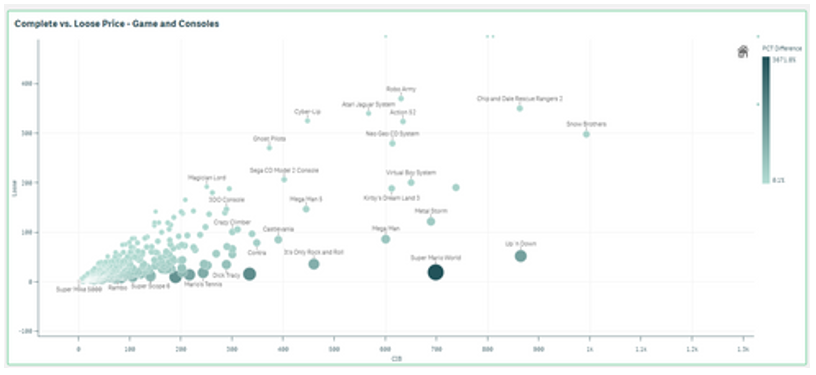
Increased Number of Visible Points in Scatter Plot
A highly-requested customer feature, the scatter plot now enables the developer to change the threshold for points on display. The maximum was previously 1500 points. The zoom and pan is adjusted automatically for large volumes and selection, tooltip and brushing turns off for larger data point sets.
New Styling Panel
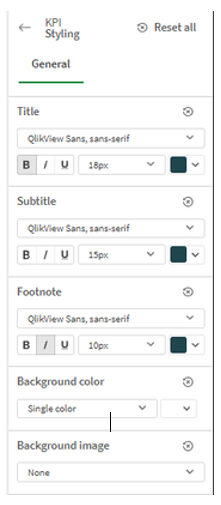
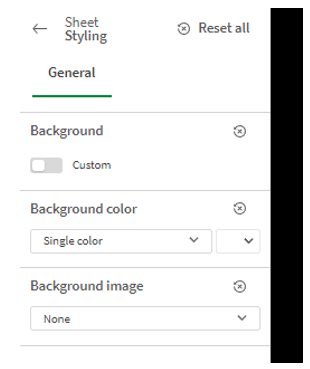
A new Styling Panel has been added to Gauge, Histogram, and Waterfall Charts; plus, Box Plot, Distribution Plot, and KPI objects, providing greater flexibility and customization. Previously the Styling Panel was added to Bar, Pie, Map, Table, and Pivot Charts. Styling covers titles, subtitles, and footnotes, with options for font size, color, and family. Sheet background color and image can now also be added.
Styling Panel for Straight and Pivot Tables
Provides flexibility, allowing customers to conform to company, department, or personal style standards and preferences. Styling covers titles, subtitles, and footnotes, and includes options for font size, color, and family.
Chart Animations
Chart animations are the gradual transitions in a visualization from the old view to the new view when data has been changed, for example, after a selection has been made. Animations can be turned on or off under app settings.
New Sheet Grid and Sheet Background Options
Sheets can now have custom background images and colors, allowing you to divide your sheet into sections, add images from your media library, and much more! On top of that, a finer grid has been added to the sheet, allowing for additional control over object placement and sheet grid size to support advanced formatting for presentations.
Augmented Analytics
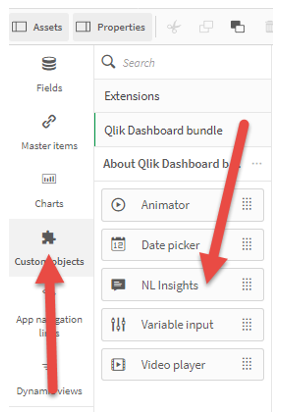
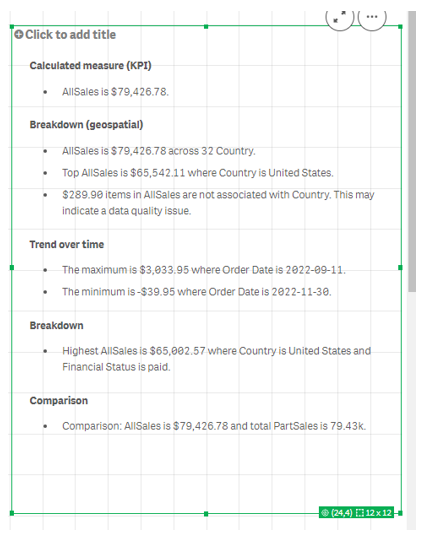
Ability to add Natural Language to Sheet as an Object
Qlik Sense™ now includes a natural language object that can be added directly to dashboards and applications to deliver AI-generated insights. App creators can configure the NLG object to produce narratives for any context by choosing dimensions, measures, and applicable analysis types – delivering insights for the overall context of a sheet, describing a group of visualizations, or creating readouts for individual visualizations. This capability extends our NLG capabilities beyond the Insight Advisor experience, allowing all Qlik Sense™ users to benefit from narrative interpretations and readouts when exploring in dashboards, boosting data literacy, and driving improved data storytelling.
Connectivity
Support Views/Lists in Office 365 SharePoint Connector
You can now access data stored in ServiceNow. The new ServiceNow connector allows you to include ServiceNow data, such as incidents, requests, and case records within your analysis. The new connector includes security options such as OAuth or SSL to ensure that only authorized users can access this data.
Change S3 connector to use AWS SDK for .NET Core
Qlik™ is planning to add more security enhancements to this connector which require the use of AWS SDK. In preparation for these future capabilities, new versions of the Amazon S3 storage and metadata connectors built using AWS SDK for .NET have been released and are called Amazon S3 Connector V2. Note that, for now, the initial release of the S3 Connectors V2 and the existing S3 connectors (which rely on the REST API) will both have the same capabilities. However, new capabilities will only be added to the V2 connectors going forward. It is also anticipated that at some point in the future, the existing S3 Connectors will be depreciated.
For information about Qlik™, please visit this site: qlik.com.
For specific and specialized solutions from QQinfo, please visit this page: QQsolutions.
In order to be in touch with the latest news in the field, unique solutions explained, but also with our personal perspectives regarding the world of management, data and analytics, we recommend the QQblog !
