In this article, we aim to provide a demonstration of creating a data product. However, before we get started, we need to have an understanding of what a dataset is, because data products are going to use datasets.
What is a dataset?
A dataset is more than just a connection to a data source, it’s a managed, reusable data asset that transforms raw data connections into trusted, governed and shareable data. Traditionally, in Qlik data lives inside individual apps or inside QVD files which resided on a file system which often led to duplication and sometimes repeated efforts. But with data sets we prepare the data once and reuse it across multiple apps improving consistency and efficiency. Datasets introduce an added layer of governance and transparency through features like the Qlik Trust Score, Data Lineage,Data Profiling,Metadata and Data QualityandData Validation which helps users better understand and trust the data they’re working with. These data sets become the foundation for other capabilities like table recipe or data flow, and they also serve as the building blocks for data products, enabling curated and governed data to be shared across the organization.
Why it matters?
Eliminates duplication – Prepare data once, reuse everywhere
Improves trust – Built-in quality, lineage, and validation
Enables scale – Centralized data layer across apps and teams
Key capabilities
Trust Score & Data Quality
Lineage & Data Profiling
Metadata & Documentation
Governance & Audit Control
Secure sharing via Spaces
How It’s Used
Reused across multiple apps
Table Receipe & Dataflow & Predict
Forms the foundation of Data Products
Ultimately, this reflects a broader shift from an app-centric model to a data-centric architecture where data is centrally managed, reusable and scalable, helping organizations oranize, govern, and confidently use their data for analytics.
Bigger Picture
Datasets shift Qlik from app-centric → data-centric architecture, serving as the building blocks for trusted analytics and future semantic layers.
Bottom Line
Organize → Govern → Reuse → Scale
For a brief video presentation, please watch the video below.
Creating and Exploring Datasets in Qlik Cloud
Now that we have a basic understanding of datasets, let’s dive into a demonstration of how to create one and explore its various capabilities and components.
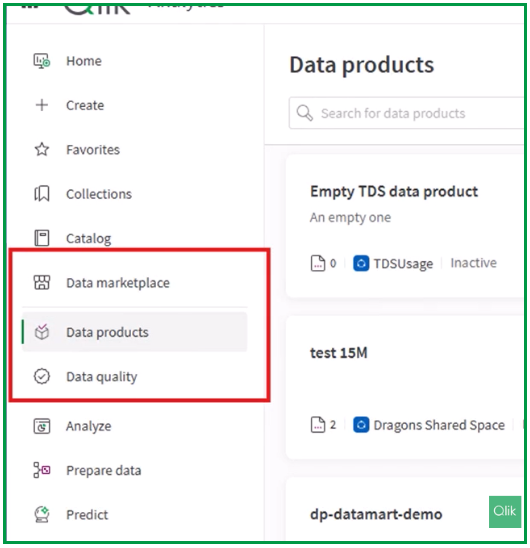
Accessing New Entry Points
As a review, Data Products, Data Marketplace, and Data quality entry points are now accessible directly in Qlik Cloud Analyticsvia the Activity Center. Previously they were only available in Qlik Talend Cloud Data Integration.
In the following sections, we will walk through the steps to create a dataset together, and you will find a full video demonstration at the end of this article to see the process in action.
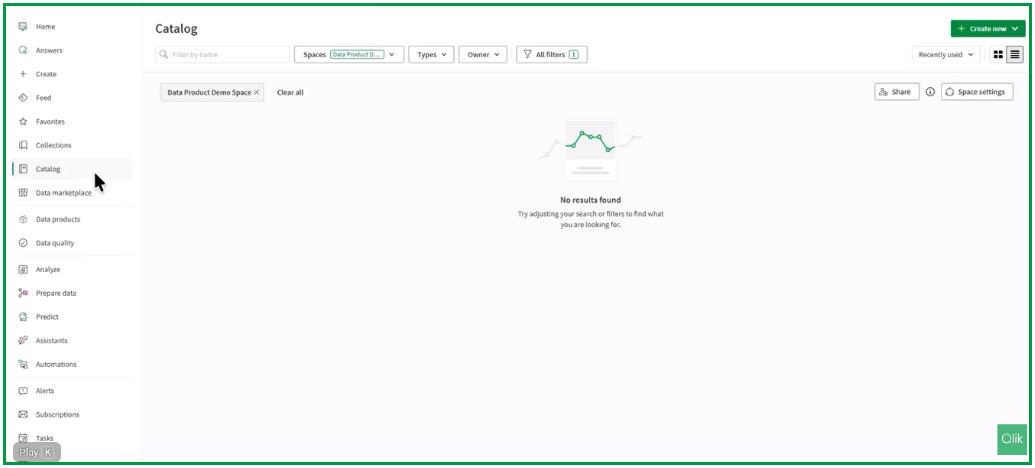
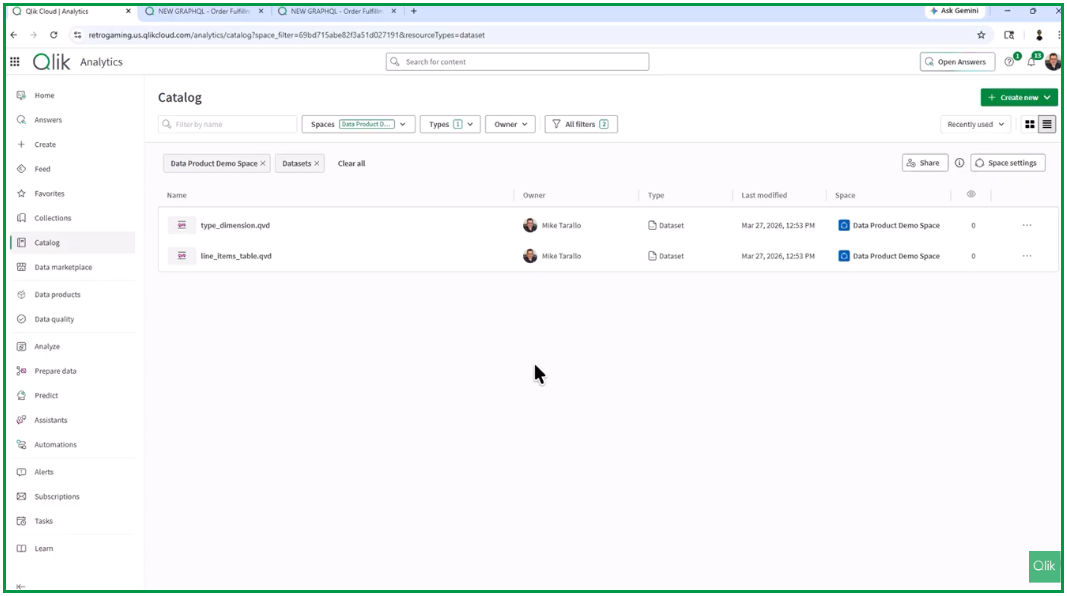
Step 1: Navigating the Catalog
First get the Catalog Activity Center where you have a space name Data Product Demo Space. This is a shared space that currently doesn’t have any objects in it.
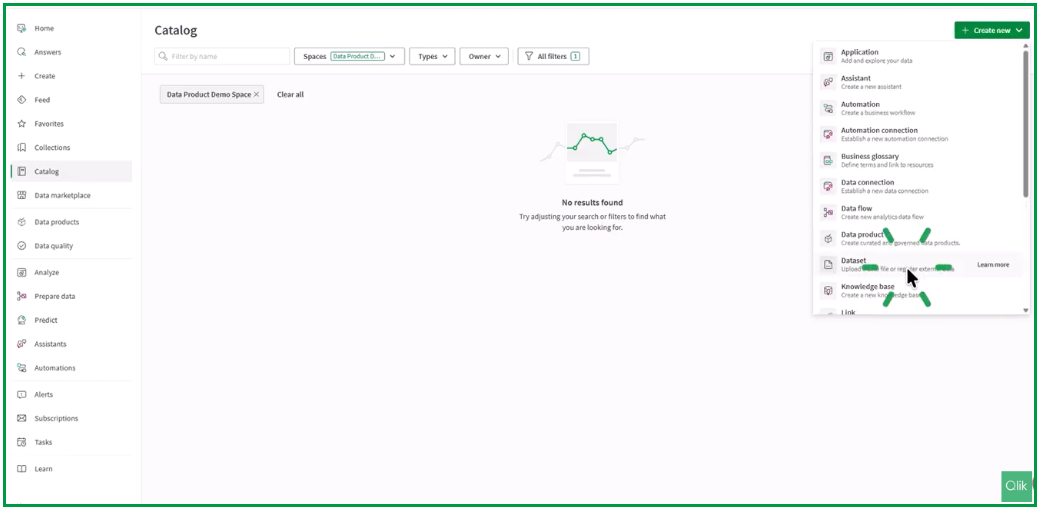
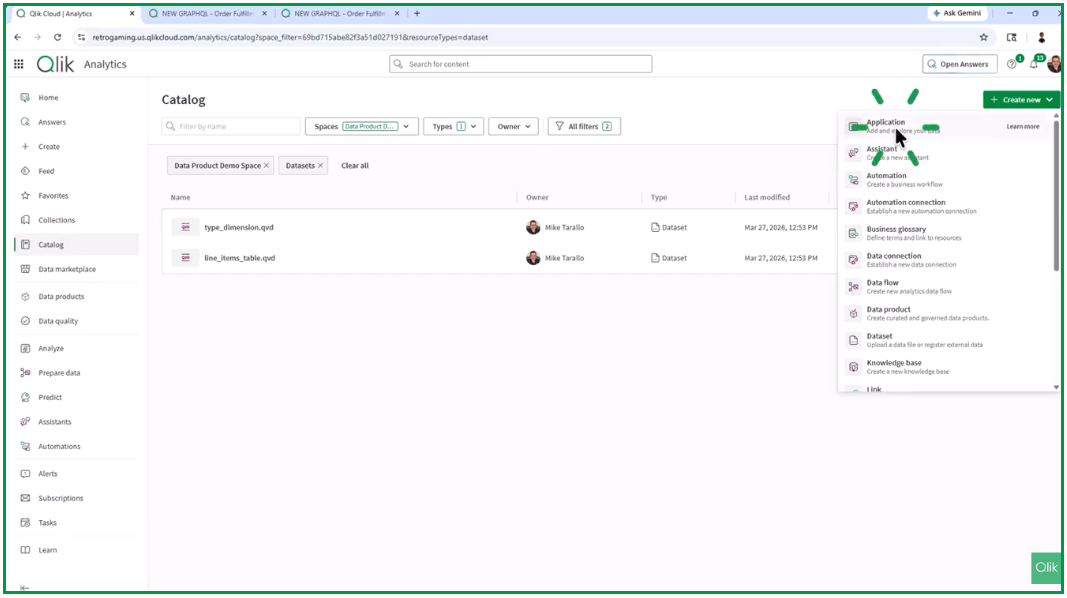
Go to Create new and then select Dataset.
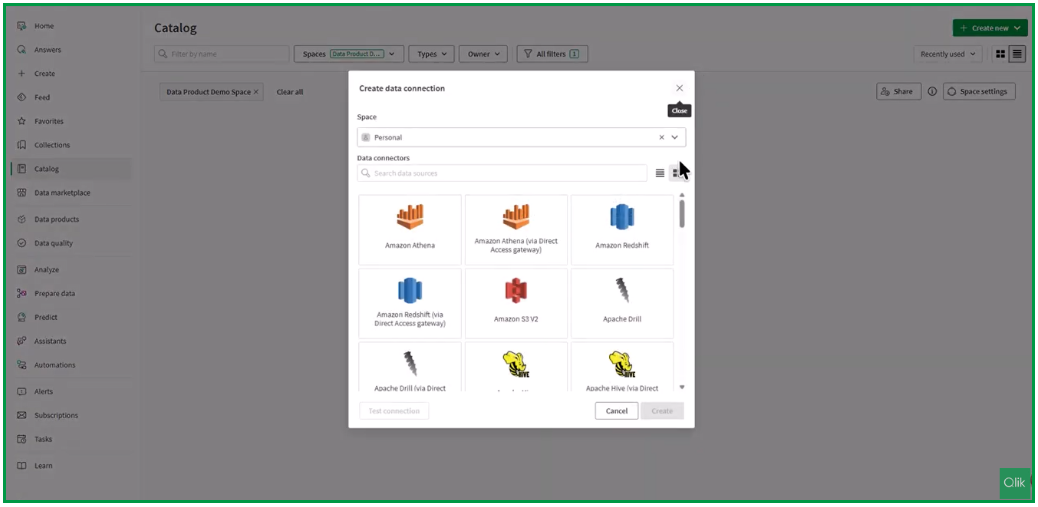
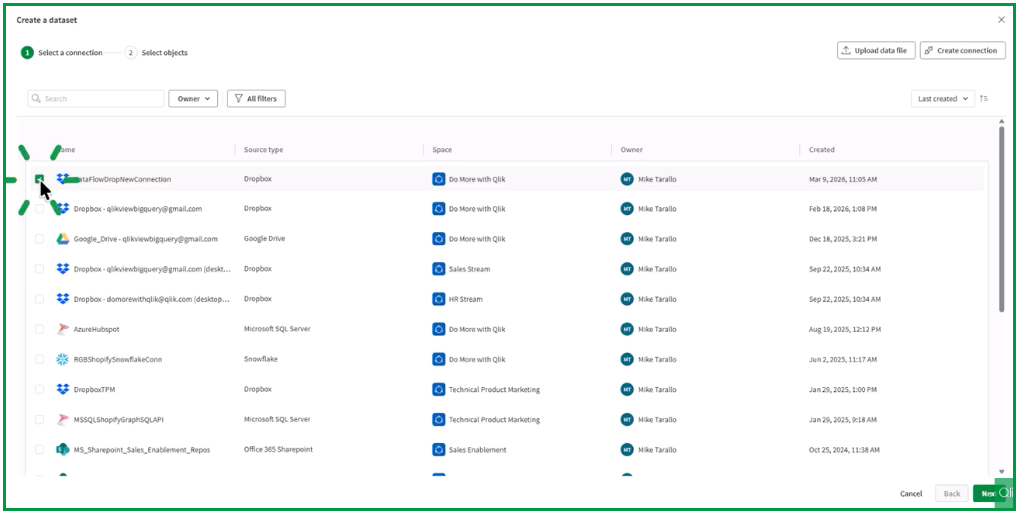
Step 2: Choosing Your Connection
When you chose Dataset, you’re presented with a list of predefined connections.
From here, you have several options:
Upload a local file: Click on Upload data file, add that as part of a dataset and that will be stored in the Qlik Cloud Analytics data store;
Create a new connection, clickin on Create new.
Important Note:If you create a new connection, you’re only presented with connections that support the concept of a dataset.
This differs from the process of creating an application; when accessing data connections for an app, you have a lot more connections to choose from.
The reason for this is that when datasets are created, they must support the stability and structure of the data they access. Not all connections offer this—for example, REST API flows.
While you are limited to certain connections, the majority of those used for analytics are fully supported.
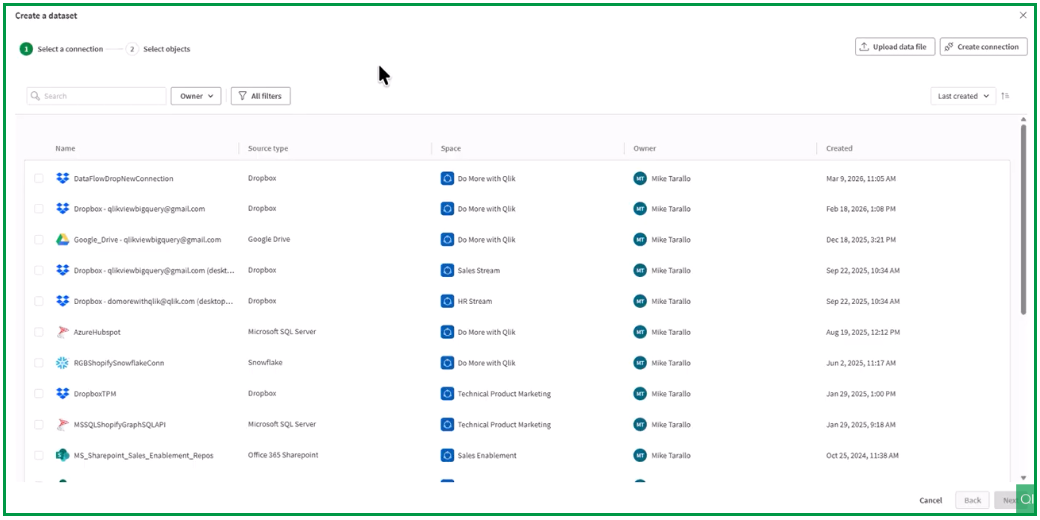
Step 3: Selecting Data Sources
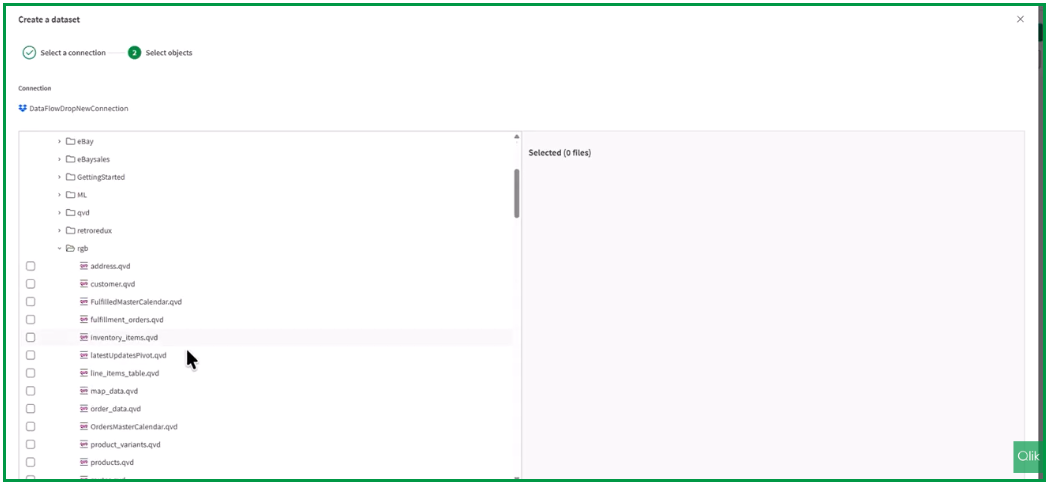
For this demonstration, we will choose the Dropbox connection. We are accessing a cloud file and will navigate through the folder structure.
In the folders, you will find several QVD files.
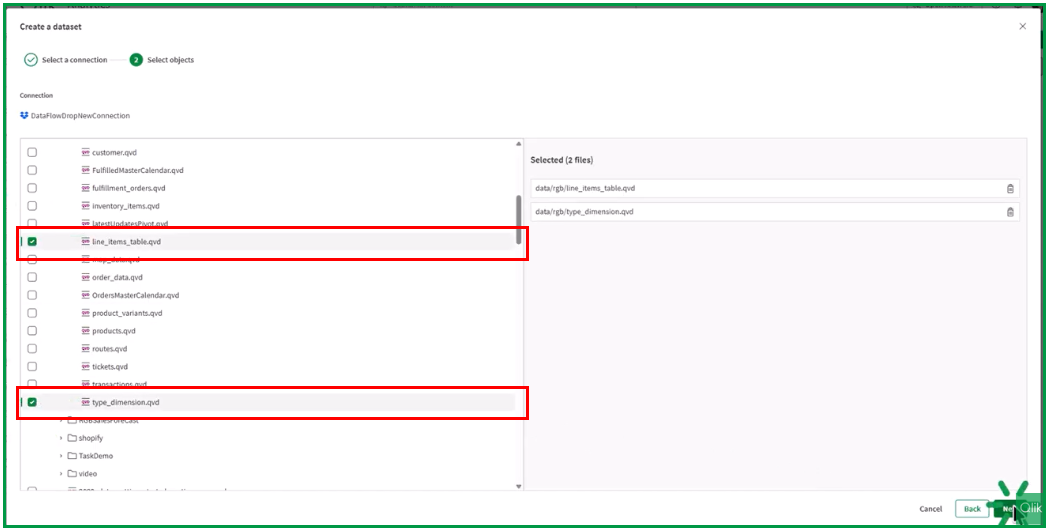
These QVD files represent data used in an order fulfillment analysis app. You can actually see this relationship through the data lineage as well. To keep it simple, we are going to select the Line Items table and the Type Dimension table. Click Next.
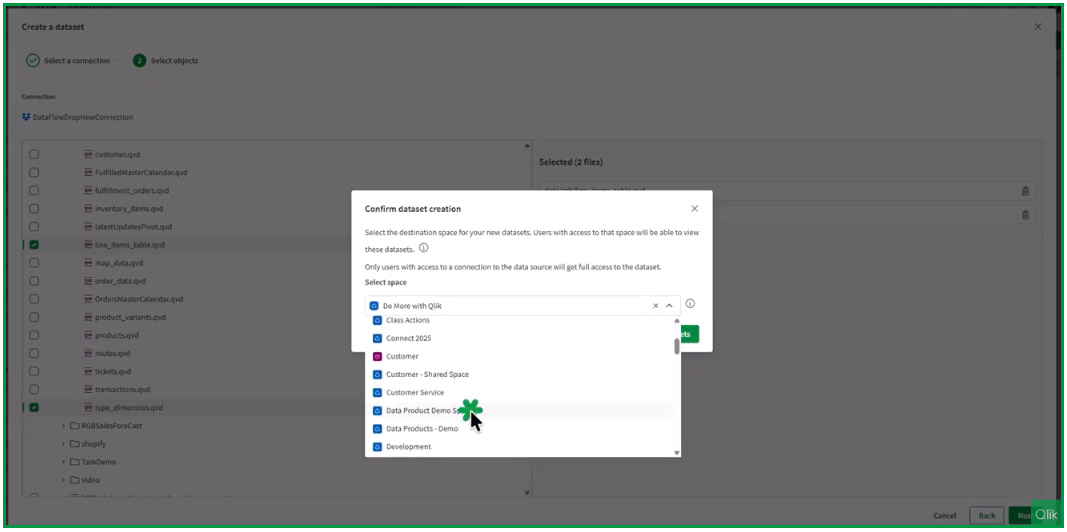
Confirm the creation, assign the datasets to the Data Product Demo Space, and create them.
Step 4: Ready for Consumption
Now, these datasets are cataloged and ready to go. They can be used immediately within an app.
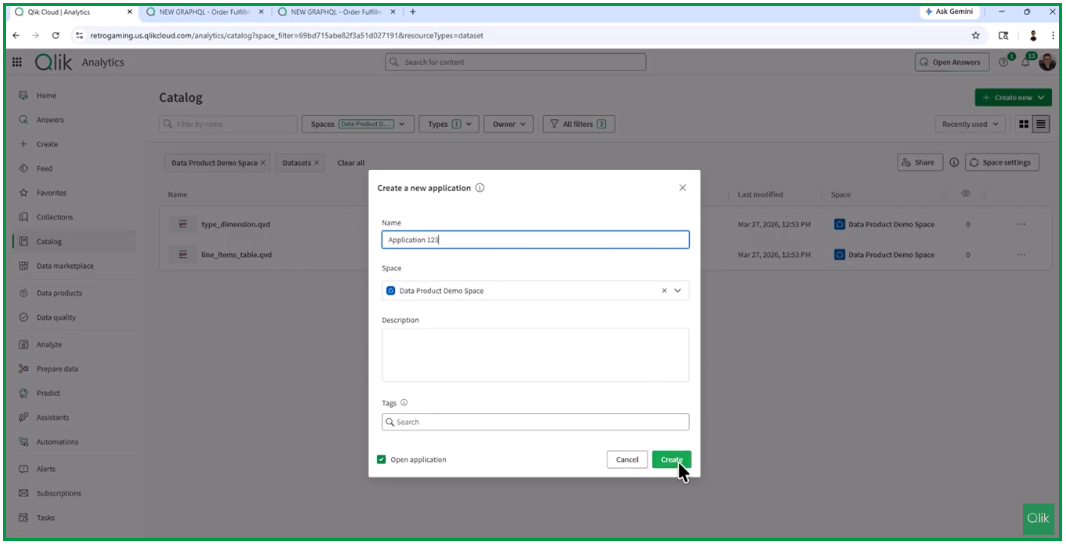
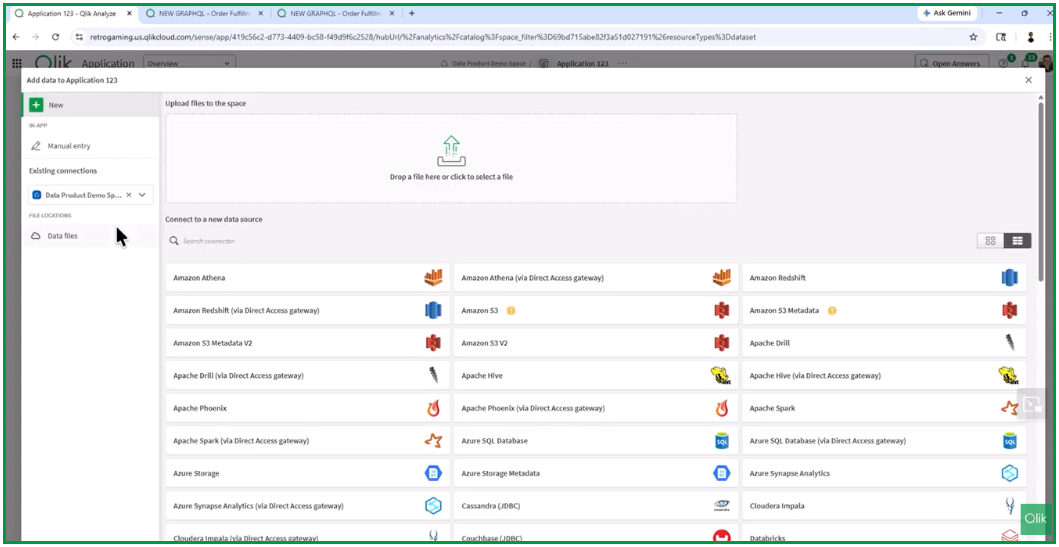
To demonstrate the concept: if you go to Application, create a new one (e.g., “Application 123”), and click Create.
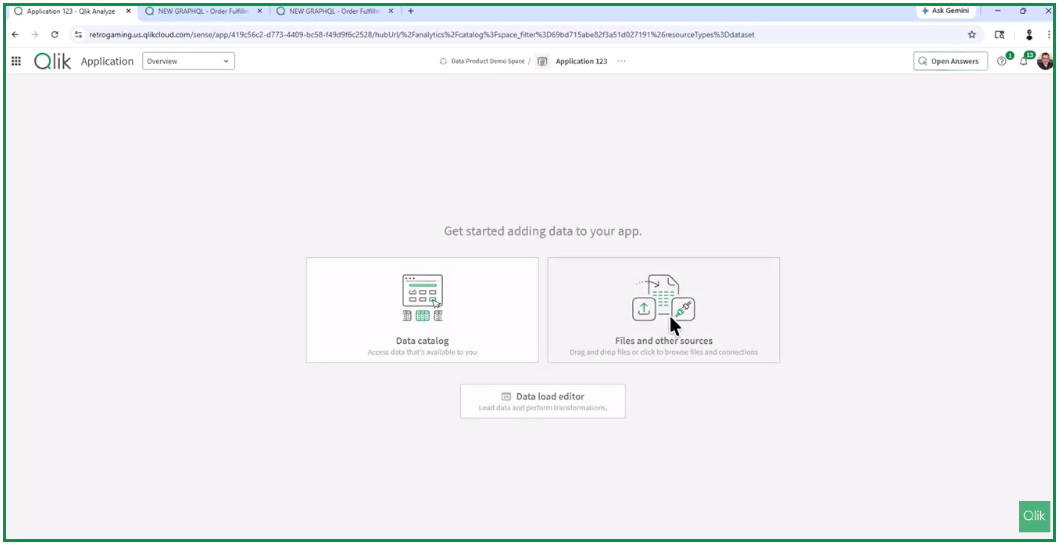
When the app is created, you have the option of choosing your traditional files and other sources, or you can select from the Data Catalog. Selecting from the catalog allows you to choose an existing dataset or a data product.
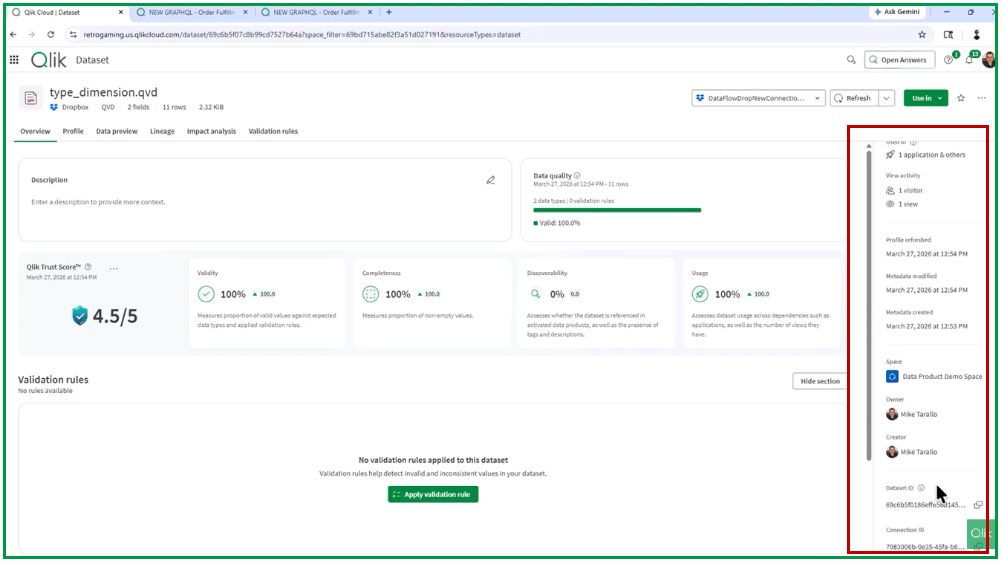
Step 5: Dataset Overview and Profiling
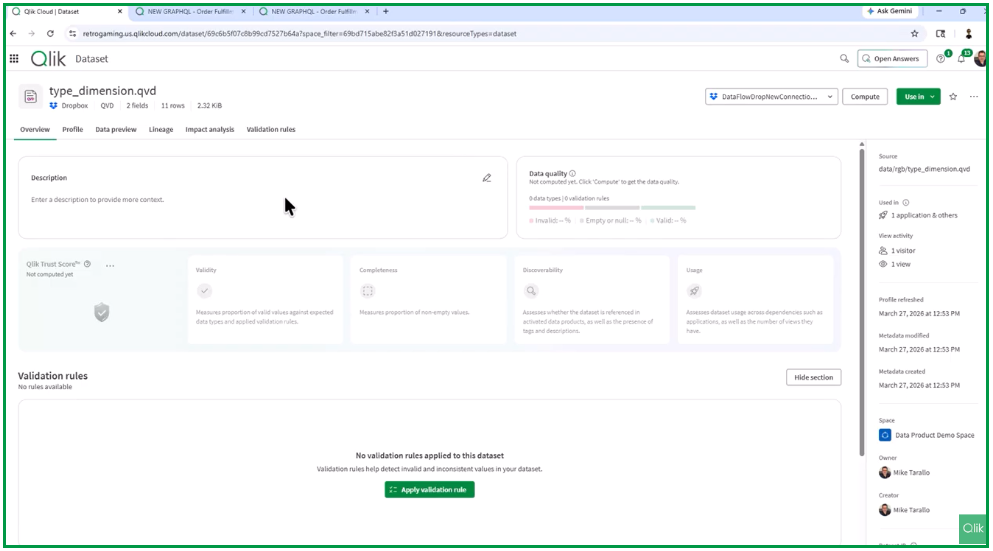
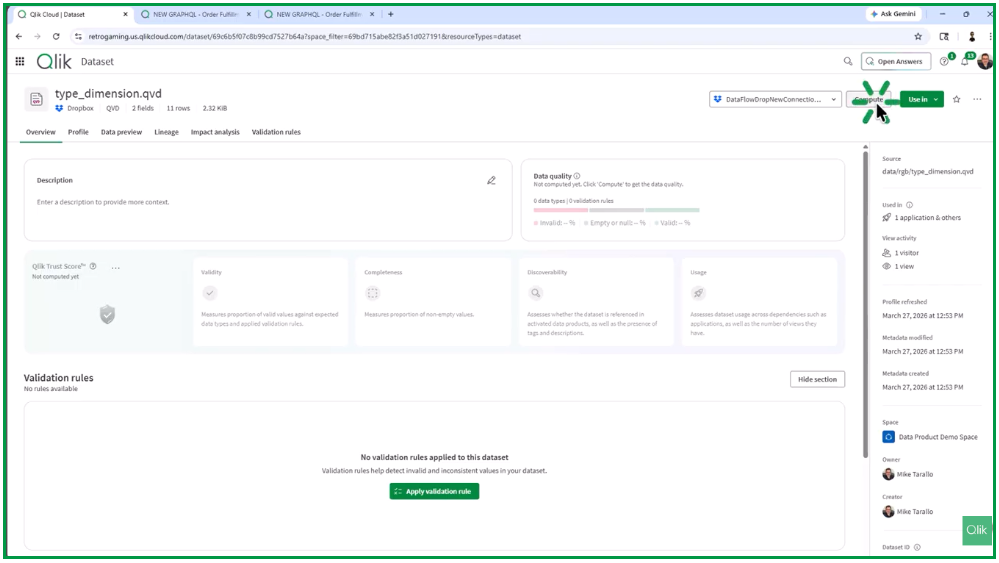
Returning to the catalog and our datasets, the next part is selecting the dataset and exploring what it has available. We will look at the Type Dimension because it only contains two fields. From this view, you can immediately add a description or documentation. You will notice a number of tabs. You have the ability to Compute meaning—the system will perform scanning and profiling on the data. This is usually the first step needed if the data hasn’t been accessed through an app yet.
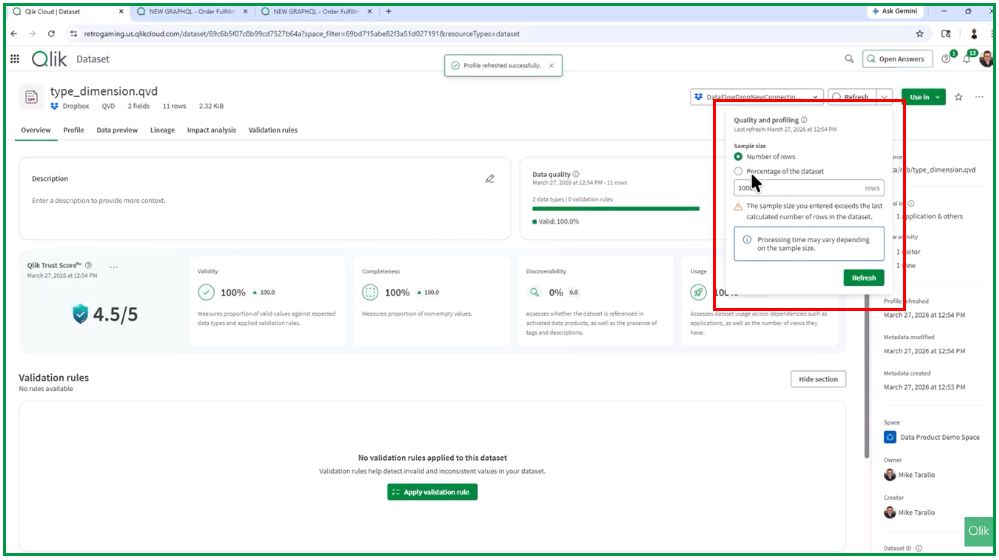
Click Compute. This uses a default sampling size of 1,000 rows, but you can change that sample size if needed.
Once the profile has been refreshed, you can view the analyzed data.
You can change these or you can select by percentage of the dataset. Depending o the number of rows in your data, it could take significantly longer.
Step 6: Quality Scores and Metadata
Now we have an initial Qlik Trust Score and can see Data Quality metrics (though we haven’t applied validation rules yet). The Dataset Overview also provides additional metadata:
Source information and where the dataset is currently being used.
Usage stats: Who else is looking at it and when it was last profiled.
Ownership: Location, owner, and creator details.
Technical Info: Global Unique Identifiers (GUIDs) that might be needed for troubleshooting and support.
For a video demonstration, please watch the video below.
For information about Qlik™, click here: qlik.com. For specific and specialized solutions from QQinfo, click here: QQsolutions. In order to be in touch with the latest news in the field, unique solutions explained, but also with our personal perspectives regarding the world of management, data and analytics, click here: QQblog !
This website uses cookies to improve your experience. We'll assume you're ok with this, but you can opt-out if you wish.AcceptRejectRead More
Privacy & Cookies Policy
Privacy Overview
This website uses cookies to improve your experience while you navigate through the website. Out of these, the cookies that are categorized as necessary are stored on your browser as they are essential for the working of basic functionalities of the website. We also use third-party cookies that help us analyze and understand how you use this website. These cookies will be stored in your browser only with your consent. You also have the option to opt-out of these cookies. But opting out of some of these cookies may affect your browsing experience.
Necessary cookies are absolutely essential for the website to function properly. This category only includes cookies that ensures basic functionalities and security features of the website. These cookies do not store any personal information.
Any cookies that may not be particularly necessary for the website to function and is used specifically to collect user personal data via analytics, ads, other embedded contents are termed as non-necessary cookies. It is mandatory to procure user consent prior to running these cookies on your website.