Distribute chart images through Qlik™ Application Automation
Qlik™ announces a significant enhancement to Qlik™ Application Automation with the introduction of the Get Chart Image block in the Qlik Reporting® connector. This new feature allows users to generate chart images directly within their automation workflows, streamlining the process of sharing visual insights.
Key Features
Generate Chart Images:Easily create images from your charts without the need for manual screenshots or additional tools.
Distribute Effortlessly: Utilize various connectors within Qlik™ Application Automation to share these images across multiple platforms, including popular chat tools like Slack and Microsoft Teams.
Embed in Emails: Seamlessly embed chart images into HTML emails, ensuring that your recipients receive immediate visual insights.
Store in Cloud Services:Safeguard your generated images by storing them on cloud storage solutions such as Microsoft SharePoint, Amazon S3 or Dropbox. This update significantly enhances the reporting process by enabling:
Automation of Workflows: Automate the entire cycle from data analysis to chart generation and distribution, saving valuable time and reducing potential errors.
Real-Time Collaboration: Keep your team informed with up-to-date visualizations shared through their preferred communication channels.
Flexibility and Accessibility: Easily access and share insights across various platforms, making data-driven decision-making more efficient.
How to send a chart image to Slack, Microsoft Teams or email
With the new inclusion of the Get Chart Image block in the Qlik Reporting®connector in Qlik™ Application Automation, you now have more options to notify a group of users with more in-depth data and charts using Slack, Microsoft Teams, and email. This article will guide you in sending your first chart image to Slack with Qlik™ Application Automation.
It explains a basic example of a template configured in Qlik™ Application Automation for this scenario.
You can make use of the template which is available in the template picker. You can find it by navigating to Add new -> New automation -> Search templates and searching for ‘Send a Chart Image to Slack‘ in the search bar, and clicking the Use template option.
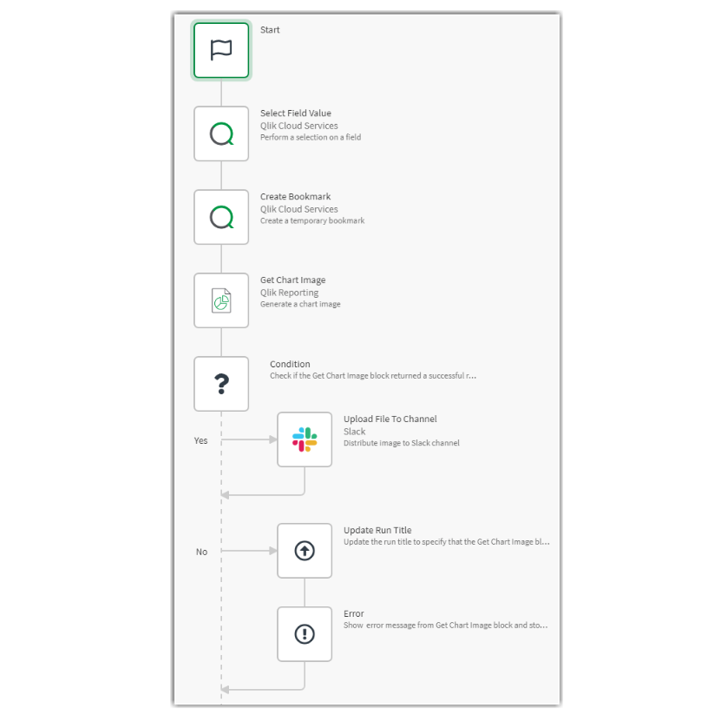
Full Automation
Configure the Automation
1. Open the automation editor and search for the Qlik™ Cloud Services connector on the left-hand menu.
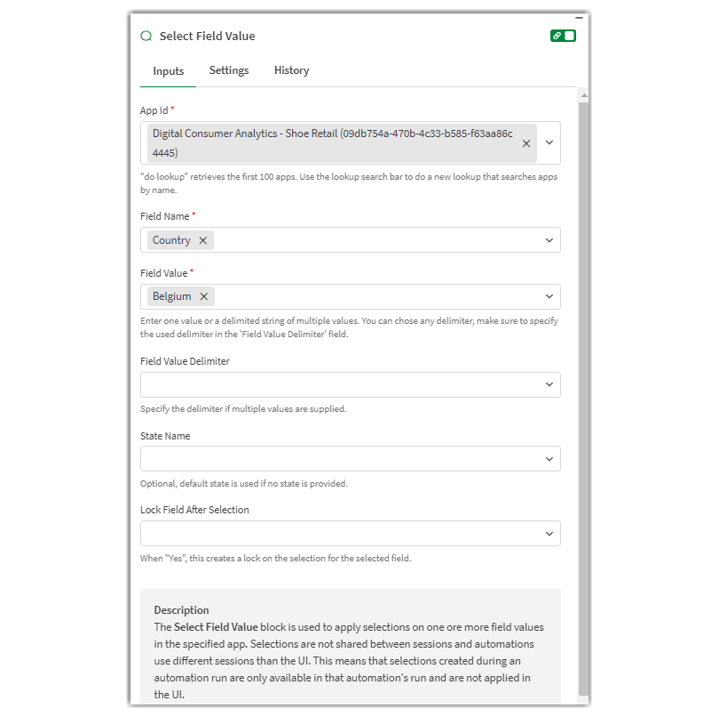
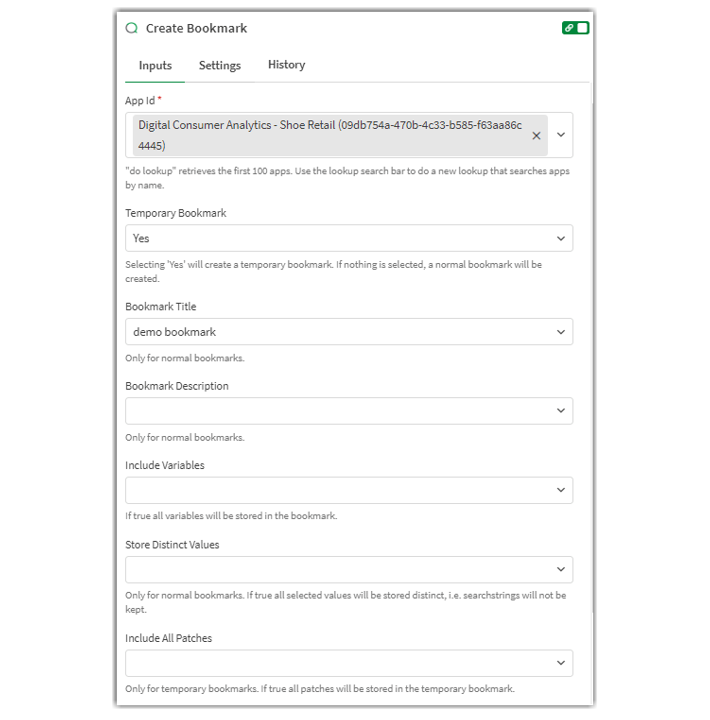
2. Drag the blocks “Select Field Value” and “Create Bookmark” to the canvas and fill in the required inputs. You can add multiple Select Field Value blocks to apply selections to various fields. The Create Bookmark block is then used to create a temporary bookmark that can pass the selections to the Get Chart Image block.
Warning: Whenever the “Get Chart Image” block is to be used, we advise you to only use it with temporary bookmarks or pre-existing persistent bookmarks.
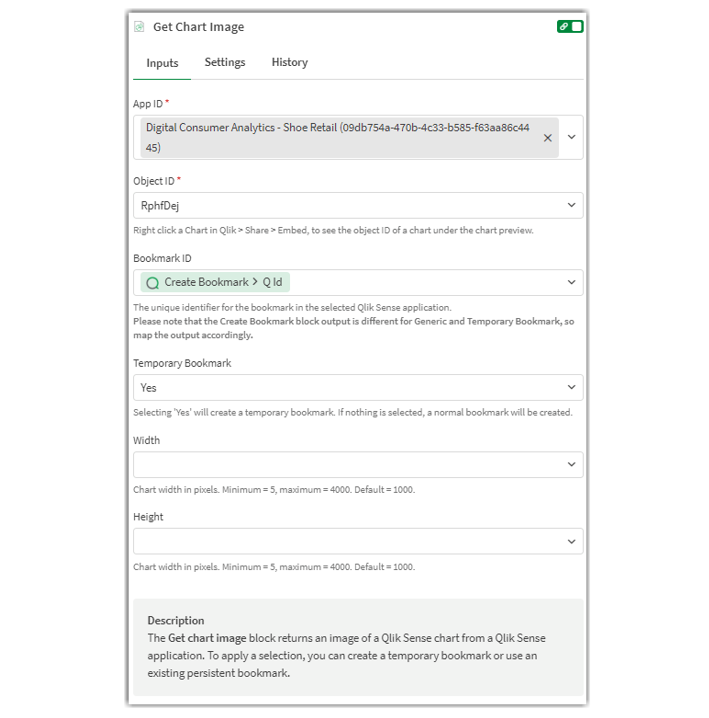
3. Search for the Qlik Reporting® connector on the left-side menu, then drag the “Get Chart Image” block to the editor and attach it below the previous block. Choose the same app you chose when creating the temporary bookmark and use the ID value received from the “Create Bookmark” block.
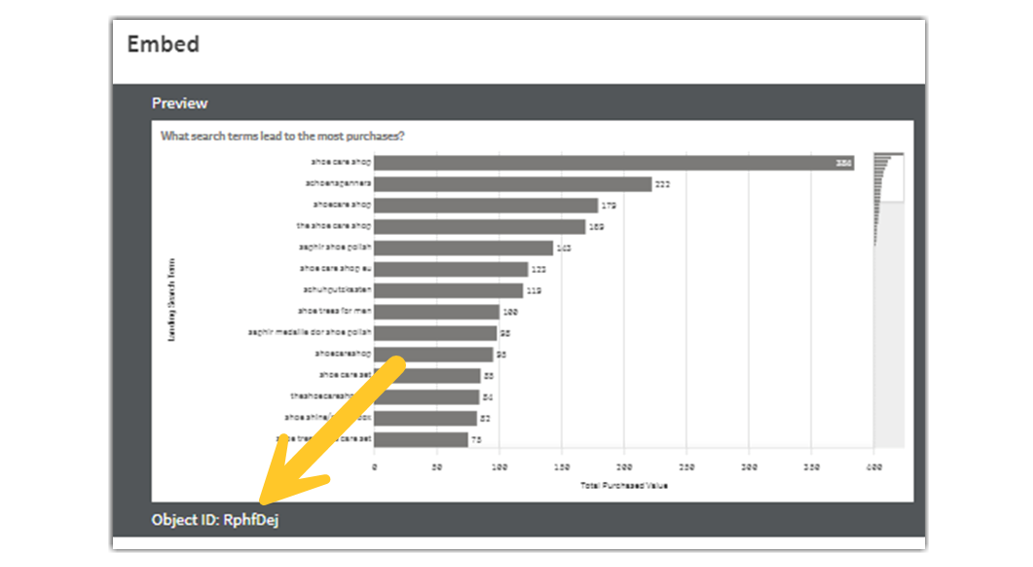
The height and width inputs are not required and default to 1000 if the fields are empty. Manually insert the Object ID input; it cannot yet be retrieved through an API call. To find the chart ID from the app, open the app, then click Edit Sheet, right-click the chart, and open the Share/ Embed menu from the menu dropdown that appears. You will see the object ID of the chart under the chart preview section as shown below:
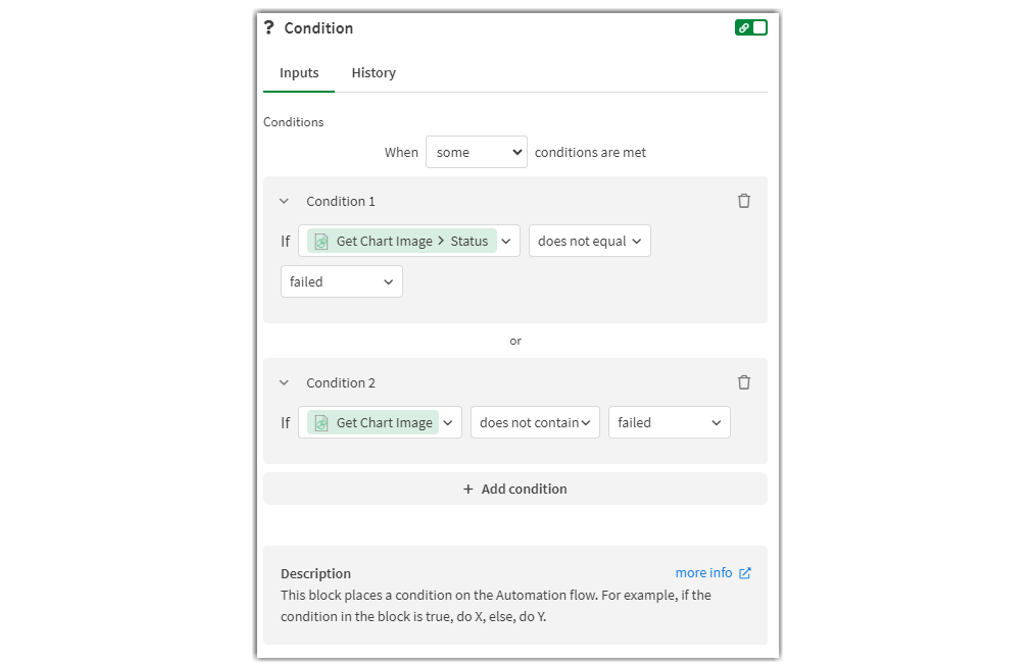
4. Add the ‘Condition‘ block to check whether the “Get Chart Image” block has returned a successful response.
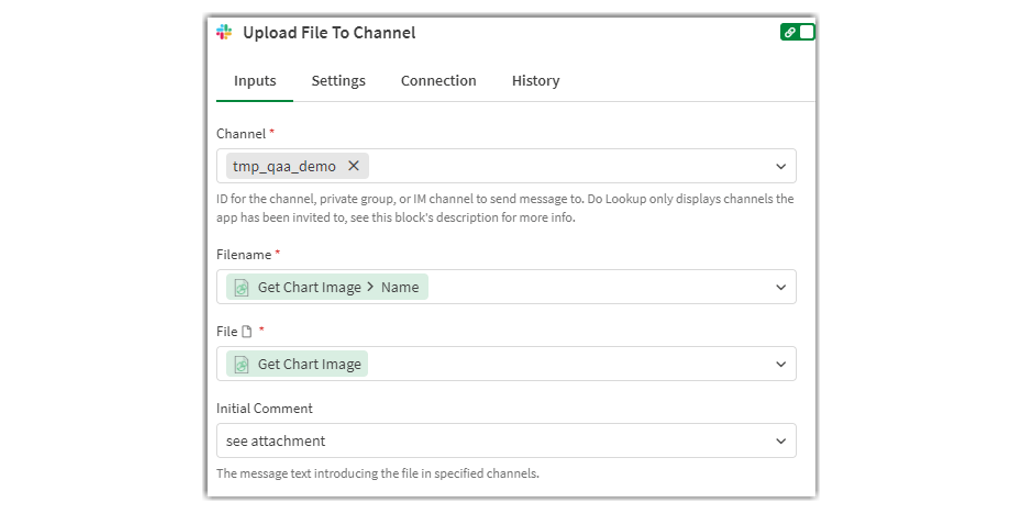
a. If the condition block outcome evaluates to true:
Search for Slack connector from the left-side menu, add the “Upload File To Channel” block, and fill in all the required inputs.
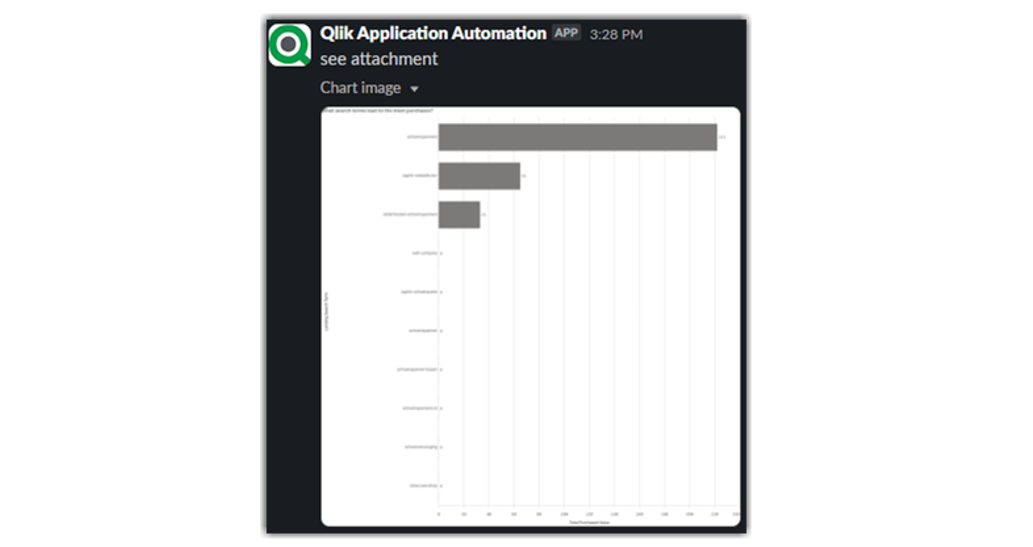
The chart image gets posted on the Slack channel as shown below:
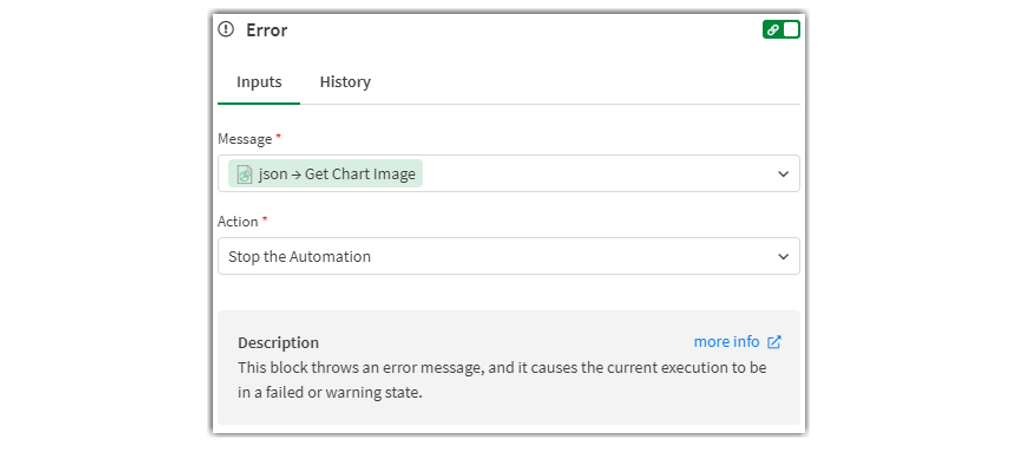
b. If the condition block outcome evaluates to false:
Add the “Update Run Title” block to specify that the “Get Chart Image” block failed due to an error.
Add an “Error” block to throw an error message from the “Get Chart Image” block and set the current automation run to be in a failed state:
Configure and send the Output
Embed the chart in the email
1. To embed the image in an email, you’ll need to replace the Slack block with Send Mail block from the Microsoft Outlook 365 connector or the Send Mail block from the Mail connector and configure the block’s Type parameter to HTML.
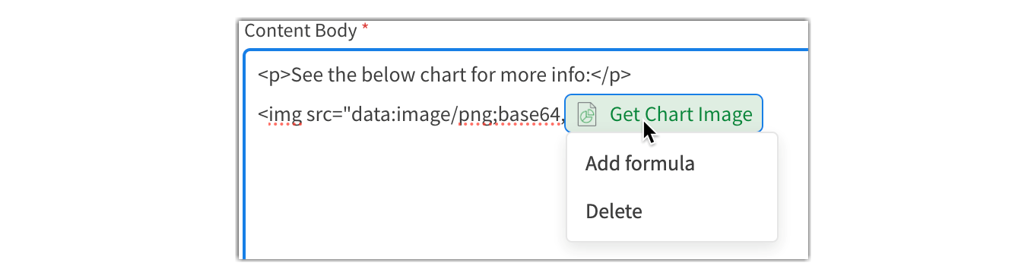
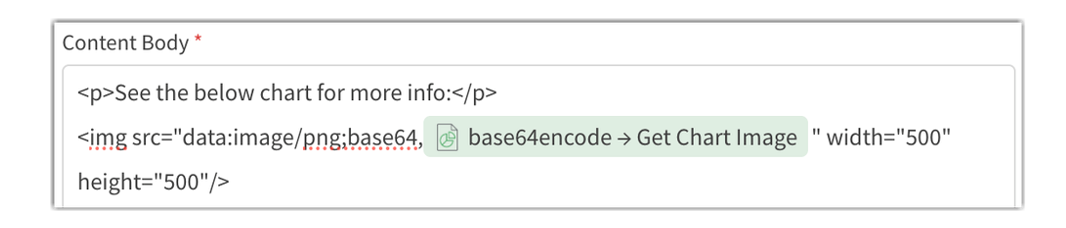
2. In the body of the HTML, start adding a <img> tag and set the src parameter of the img tag to “data:image/png;base64,”.
3. Add the Get Chart Image block output at the end of the src parameter.
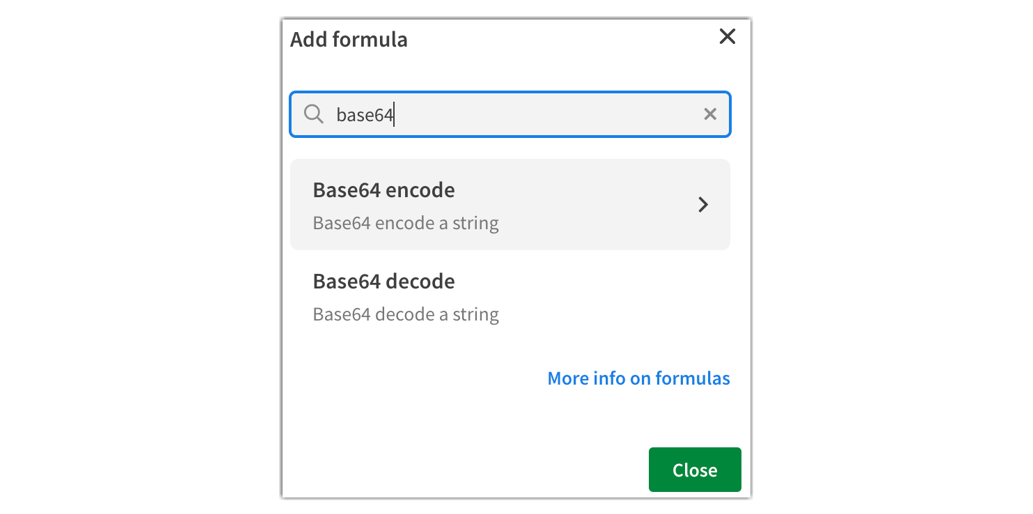
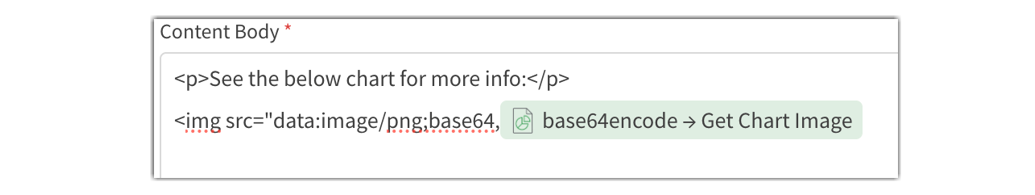
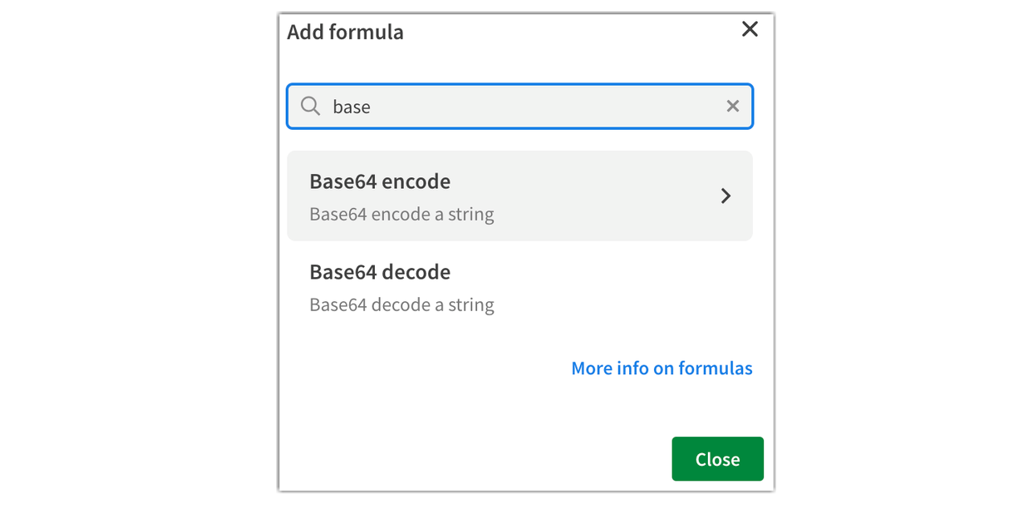
4. Click the Get Chart Image label in the input parameter, and pick the Add formula option; then search for the “base64 encode” formula to apply it to the output from the Get Chart Image block.
5. Finalize the img tag with an optional width and height to style the image.
Send the chart to a channel in Microsoft Teams
1. To send the image to Microsoft Teams, replace the Slack block with the Send Html MessageWith Base 64 Image block from the Microsoft Teams connector.
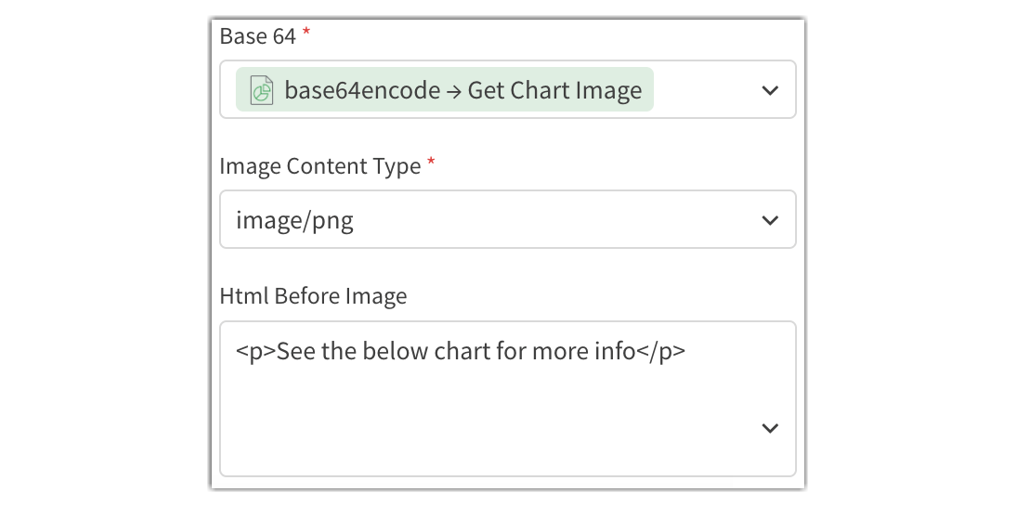
2. Configure the “Base 64” parameter of the block by mapping it to the output of the Get Chart Image block.
3. Click the field mapping for the Get Chart Image again and open the formula picker. Search for the base64 encode formula and apply it.
4.Set the Image Content Type parameter to image/png and (optionally) provide additional HTML content that will be inserted before or after the image.
The information in this article is provided as-is and will be used at your discretion. Depending on the tool(s) used, customization(s), and/or other factors, ongoing support on the solution above may not be provided by Qlik™ Support.
For information about Qlik™, click here: qlik.com. For specific and specialized solutions from QQinfo, click here: QQsolutions. In order to be in touch with the latest news in the field, unique solutions explained, but also with our personal perspectives regarding the world of management, data and analytics, click here: QQblog !
This website uses cookies to improve your experience. We'll assume you're ok with this, but you can opt-out if you wish.AcceptRejectRead More
Privacy & Cookies Policy
Privacy Overview
This website uses cookies to improve your experience while you navigate through the website. Out of these, the cookies that are categorized as necessary are stored on your browser as they are essential for the working of basic functionalities of the website. We also use third-party cookies that help us analyze and understand how you use this website. These cookies will be stored in your browser only with your consent. You also have the option to opt-out of these cookies. But opting out of some of these cookies may affect your browsing experience.
Necessary cookies are absolutely essential for the website to function properly. This category only includes cookies that ensures basic functionalities and security features of the website. These cookies do not store any personal information.
Any cookies that may not be particularly necessary for the website to function and is used specifically to collect user personal data via analytics, ads, other embedded contents are termed as non-necessary cookies. It is mandatory to procure user consent prior to running these cookies on your website.