Page Content
Qlik™ Talend Data Integration improvements
The enhancements outlined below require Qlik™ Data Gateway – Data Movement 2024.5.7 or later. For upgrade instructions and a list of resolved issues, see Upgrading the Data Movement gateway installation.
Enhancements
1. Support for automatic loading of new tables in replication tasks
Tables created in the source database during the replication data task that match the include pattern, will now be automatically captured during CDC (Change data capture).
2. Microsoft SQL Server (MS-CDC) source enhancements
- Timestamp and transaction ID preservation
Previously, when reading multiple transactions from Microsoft SQL Server (MS-CDC), Qlik™ Talend Data Integration would preserve the transaction ID and timestamp of the first transaction only. On the target, this gave the appearance of the records being part of a single transaction. Now, Qlik™ Talend Data Integration will preserve the original transaction ID and timestamp for each individual record. This benefits customers who wish to leverage the Transaction ID and Timestamp header columns in Change tables. - Transaction ID bytes order
Previously, the bytes in the transaction ID were encoded in reverse order. From this version, the bytes will be encoded in the correct order. Information Customers who would rather preserve the existing behavior can do so using internal parameters. For details, please contact.
- Timestamp and transaction ID preservation
3. Support for caching SHA-2 pluggable authentication with MySQL
Qlik™ Talend Data Integration now supports caching SHA-2 pluggable authentication (caching_sha2_password) when working with MySQL sources or targets, either on-premises or in the cloud.
In previous versions, only Native Pluggable Authentication (mysql_native_password) was supported.
4. Amazon Redshift data type mapping changes
BYTES and BLOB data types will now be mapped to VARBYTE on Amazon Redshift instead of VARCHAR.
Newly certified platforms, endpoints and versions
- Data sources
- PostgreSQL 16.x
- MySQL 8.1
- IBM DB2 for z/OS 3.1
- Target platforms
- PostgreSQL 16.x
- MySQL 8.1
- Databricks 14.3 LTS
- Drivers
- SQL Server ODBC Driver 18.3
End of support
Support for the following database versions has been discontinued:
- All Oracle versions and drivers earlier than Oracle 19.x
- Microsoft SQL Server 2014
- MySQL 5.7
- PostgreSQL 11
- IBM DB2 for LUW 10.5
- IBM DB2 for z/OS: z/OS 2.3
Shared data space
With the launch of Qlik™ Talend Cloud the Starter edition was introduced to simplify the experience of creating connections and projects for straightforward replication tasks. As part of this improved experience a data space, called Default_Data_Space, is automatically created in every tenant.
This feature is extended to all editions of Qlik™ Talend Cloud: Starter, Standard, Premium și Enterprise.
The owner of Default_Data_Space will be the first admin to enter the tenant, and all users of the tenant will be automatically granted with the following permissions:
- Can view
- Can consume data
- Can edit
- Can manage
Click here to see how to work with data products.
Refine your in-app subscriptions with dynamic expressions
In-app subscriptions are now more powerful with the use of bookmark capabilities, allowing for dynamic expressions to be used in report creation! When creating and sharing subscriptions, use expression search to filter the data at report generation time based on date expressions, calculated values, and more… allowing for more accurate reports!
Expression search
With an expression search, you can search for values across all fields associated with the search field.
An expression search always begins with an equals sign (“=”). The expression is evaluated for every value in every field associated with the search field. All values for which the search expression returns a non-zero value are selected.
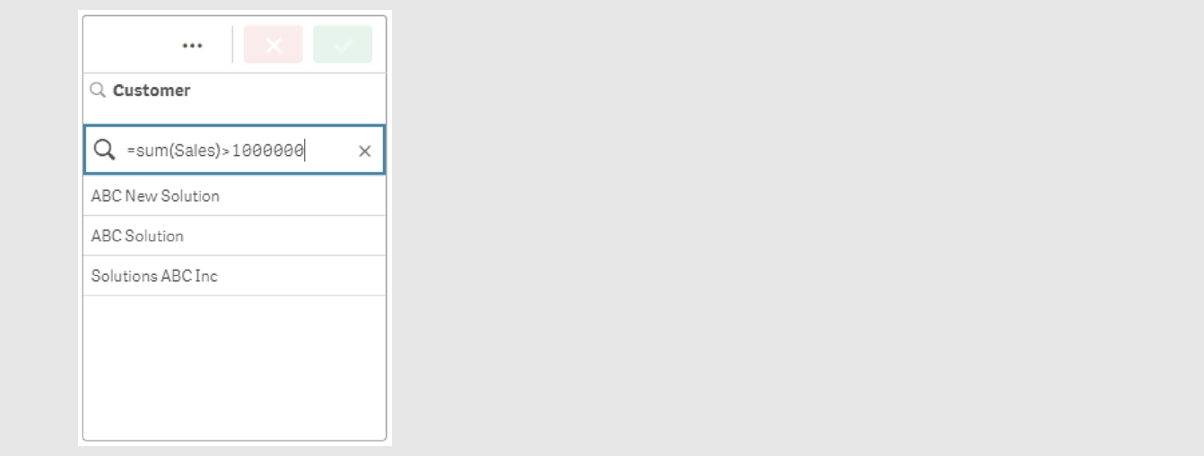
In a filter pane with Sales values, you can use a search such as: “=Sum(Sales) > 1000000” to find values larger than 1,000,000. This is a simple search and you could get the same result by using the numeric search: “>1000000”. Often, an expression search is the only choice. For example, if you want to search for values in associated fields, you have to use an expression search.
In the example below, the search “=Sum(Sales) > 1000000” in the Customer field returns every value in the Customer field for which the Sales column value is greater than 1000000.
Example
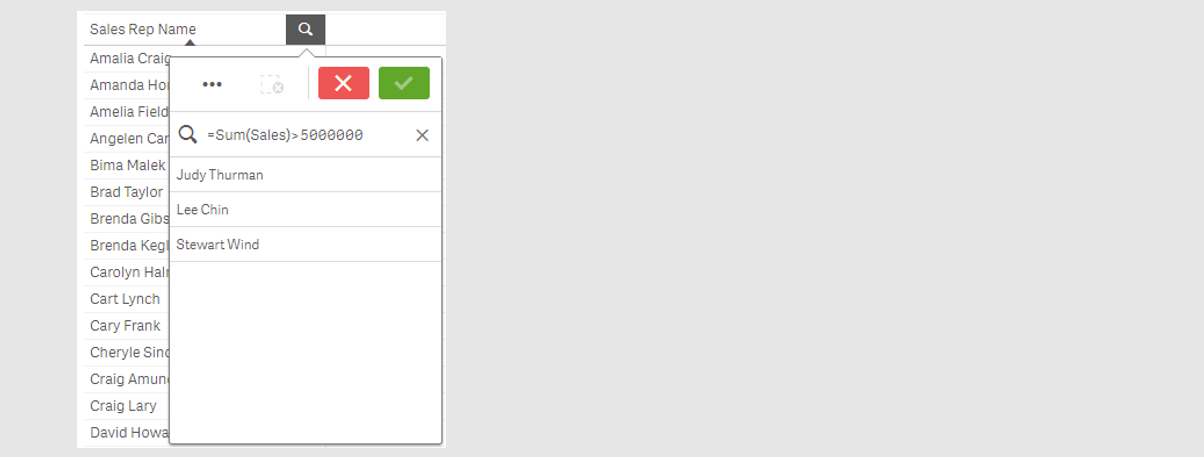
Let us assume that you have a filter pane for sales representatives. You can then use an expression search for the sales representatives who have sales larger than, for example, 5,000,000. The search string is similar to the previous one: “=Sum(Sales) > 50000000”. Because the sales values are associated with the sales representatives, you can perform the search in the Sales Rep filter pane.
Click here to see how to schedule reports with subscriptions.
General styling of bundled charts
The remaining charts in the visualization and the dashboard bundle are getting general styling including font styling of titles, background color and image options and border and shadow settings.
The charts impacted by this change are:
- Multi KPI
- Network
- PL Pivot
- Radar
- Trellis
- Variance waterfall
- Word cloud
- Animator
- Date range picker
- Variable input
- Video player
Click here for info about Visualization bundle.
Click here for info about Dashboard bundle.
New Qlik™ Application Automation connector for Qlik™ Cloud Government
Qlik™ Cloud Government now supports the following Qlik™ Application Automation connector:
- Amazon DynamoDB
Application Automation Connectors
Qlik™ Application Automation includes a set of connectors that let you integrate third-party services and applications into your data analytics workflows. This section lists the available connectors and what they are used for.
Below are the available Qlik™ Application Automation connectors that are compatible with Qlik™ Cloud Government.
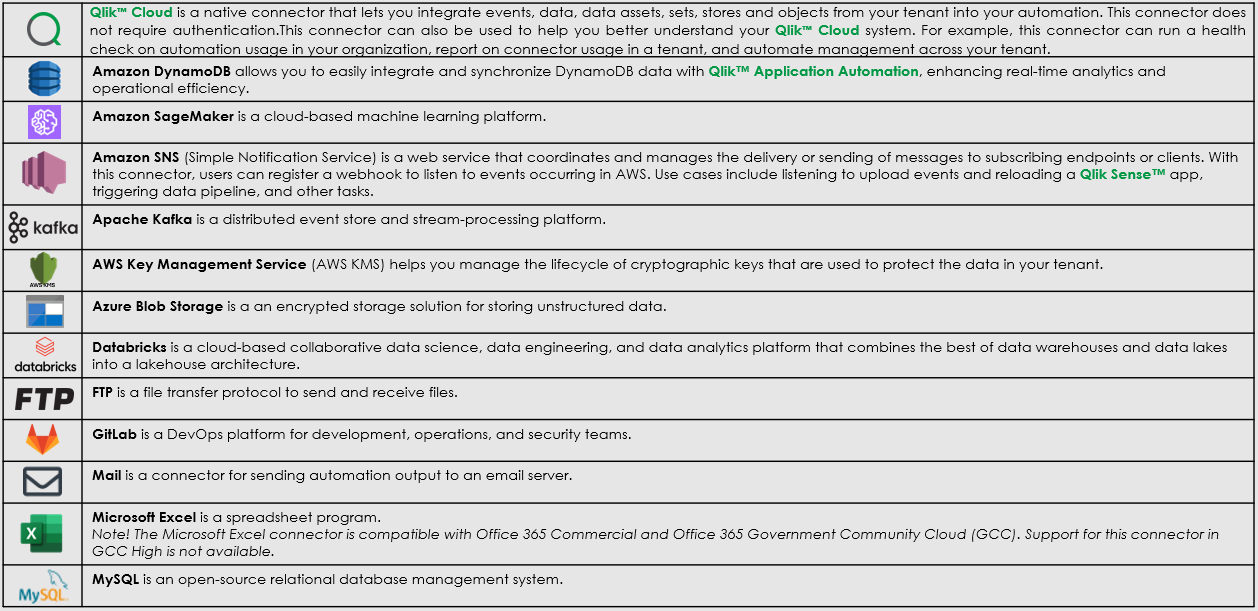
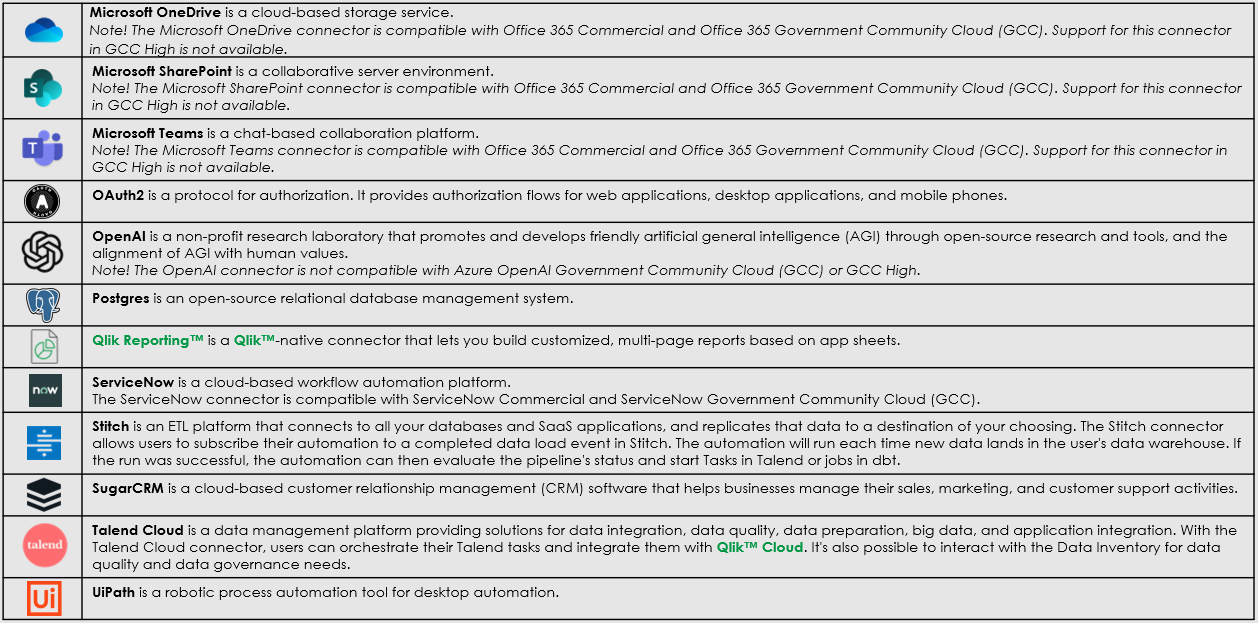
For all the Qlik™ Application Automation, connectors, click here.
Enhanced support for metadata changes in replication and lake landing tasks
Previously, when a metadata change occurred, all tables would be dropped and recreated even if the metadata change did not affect all tables. Now, only the changed tables will be dropped and recreated, thereby improving performance.
Note! Supported from Qlik™ Data Gateway – Data Movement 2024.5.7.
For upgrade instructions, click: here.
Tabular reporting template management - Changing source app at time of template upload
An optimization has been introduced to allow a template to be connected to the source app at time of upload. Previously, it had to be done by creating the connection in the Qlik™ add-in for Microsoft Excel. For example, if a report developer knows that a template is compatible with an app, and a copy of that app is available in another space or tenant, the report developer can upload the template used in the source app directly to the alternate version of the app and the connection will be created during the upload.
Note! Not supported in Qlik™ Cloud Government.
Click here to see how to work with report templates in the Qlik Sense™ app.
Search and replace in expression editor
Users can now search and replace text within the expression editor in Qlik Sense™ apps, just as they can already do in the script editor and data load editor. This includes a “replace all” option, allowing for quick bulk edits within a single complex expression.
The usability of the expression editor has also been improved by adding a confirmation dialog when closing with unsaved changes.
Click here to see how to work with the expression editor.
Expressions in field labels
You can now have expressions in field labels for drill-down and cyclic dimensions. This lets you for example enable translation of labels in multi-language apps.
Creating a drill-down dimension
When adding a dimension, you can select between creating a single or a drill-down dimension.
The following description explains how to create a drill-down group from the Create new dimensions dialog.
Note! If selections cause the current drill-down dimension field to have only one possible value, the next field in the list is used instead.
Do the following:
- Select Drill-down as dimension type.
- Click at least two fields from the fields list on the left-hand side to insert them as the referenced fields.
Tip notes:
- You can filter which table to select fields from in the drop-down list.
- You can rearrange the order of the fields you have selected by dragging them to new positions in the list of selected fields.
- Optionally, add labels for the fields added to your drill-down dimension.
Click fx in Label to add an expression for the label. The expression must start with =.
- Type a name for the dimension.
- Type a description for the dimension (optional).
If you do not add a description and then link a glossary term to your master item as a definition, the term definition will be used in the description.
- If you want to specify a color, click Arrow down icon (↓) in the color drop down and select a color through one of the following methods:
- Click one of the colors in the palette.
- Type a 6 character color code in the Hex input field: #.
- Click Show icon options at the bottom of the dialog, select a color in the color wheel, and optionally adjust the saturation slider.
- Add tags (optional).
- Optionally, if you have access to a glossary, link the dimension to a glossary term.
Click here to see how to link terms to master items.
- Click Create.
- Click Close.
The drill-down dimension is now saved in the Dimensions category among the master items.
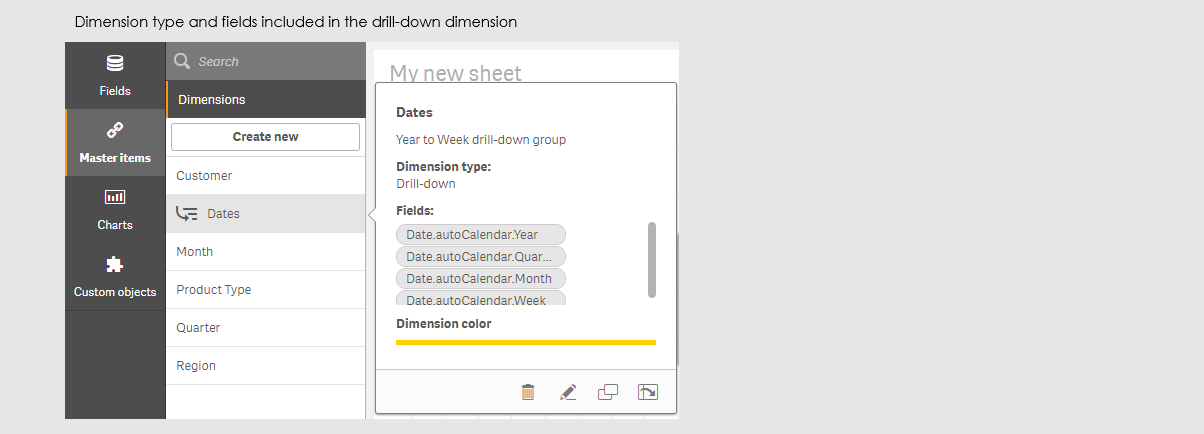
When you click the dimension in the panel on the left-hand side, the preview displays the dimension type and which fields are included in the drill-down dimension.
The screenshot below shows the type of dimension and which fields are included in the drill-down dimension.
Creating a cyclic dimension
When adding a dimension, you can select between creating a single, drill-down, or cyclic dimension.
The following description explains how to create a cyclic dimension from the Create new dimensions dialog.
Do the following:
- Select Cyclic as dimension type.
- Click at least two fields from the fields list on the left-hand side to insert them as the referenced fields.
Tip notes:
- You can filter which table to select fields from in the drop-down list.
- You can rearrange the order of the fields you have selected by dragging them to new positions in the list of selected fields.
- Optionally, add labels for the fields added to your cyclic dimension.
Click fx in Label to add an expression for the label. The expression must start with =.
- Introduceți un nume pentru dimensiune.
- Introduceți o descriere penru dimensiune (optional).
Dacă nu adăugați o descriere și apoi legați un termen din glosar la elementul principal ca definiție, definiția termenului va fi utilizată în descriere.
- If you want to specify a color, click Arrow down (↓) in the color drop down and select a color through one of the following methods:
- Click one of the colors in the palette.
- Type a 6 character color code in the Hex input field: #.
- Click Show options at the bottom of the dialog, select a color in the color wheel, and optionally adjust the saturation slider.
- Add tags (optional).
- Optionally, if you have access to a glossary, link the dimension to a glossary term.
Clic here to see how to link terms to master items.
- Click Create.
- Click Close.
For information about Qlik™, click here: qlik.com.
For specific and specialized solutions from QQinfo, click here: QQsolutions.
In order to be in touch with the latest news in the field, unique solutions explained, but also with our personal perspectives regarding the world of management, data and analytics, click here: QQblog !