- Qlik Sense Enterprise™ for Windows
- Qlik Sense SaaS™
- Qlik DataTransfer™
- Qlik GeoAnalytics™
- Qlik NPrinting™
- Qlik Alerting™
Interface Development & New Visualizations
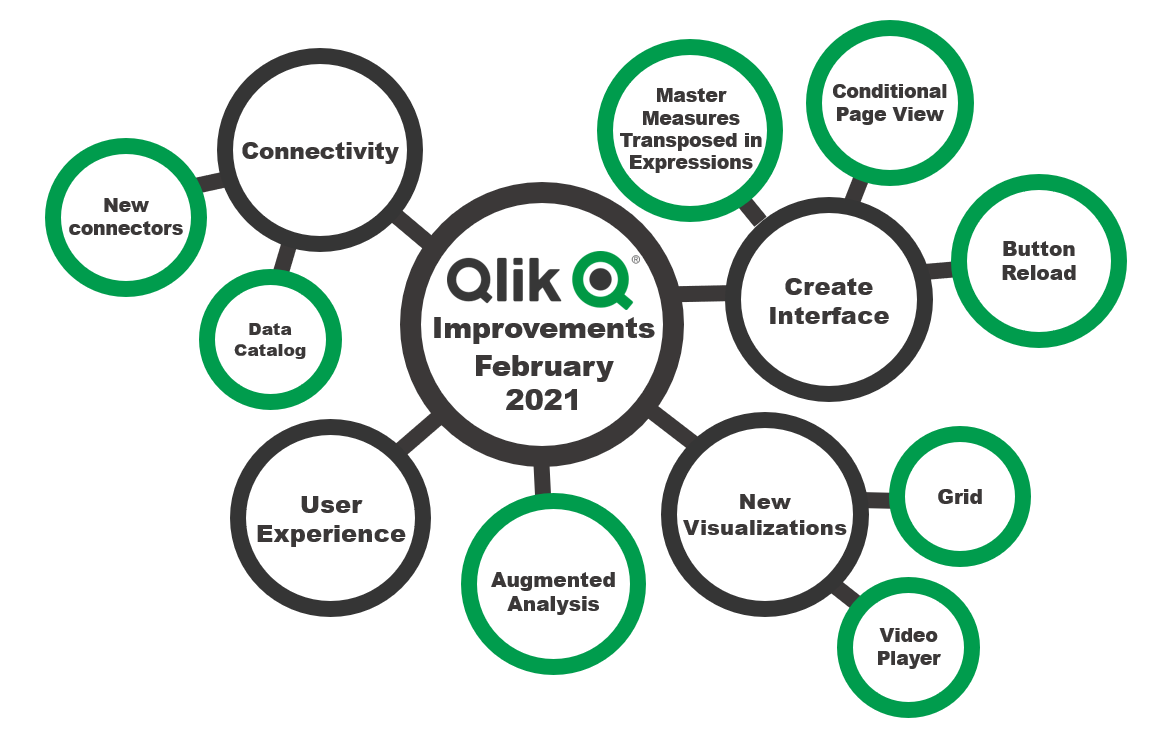
One of the constant Qlik™’s development remains the provision of world-class visual analysis. So, this edition also brings news in this field. New options and views have been added to increase the efficiency of dynamic information consumption and analysis production.
Improved Interface Development
Master Measures Now Transposed in Expressions
Starting with this version it is possible to reuse the master measures in expressions. This simple yet powerful improvement allows users to significantly improve author productivity and governance.
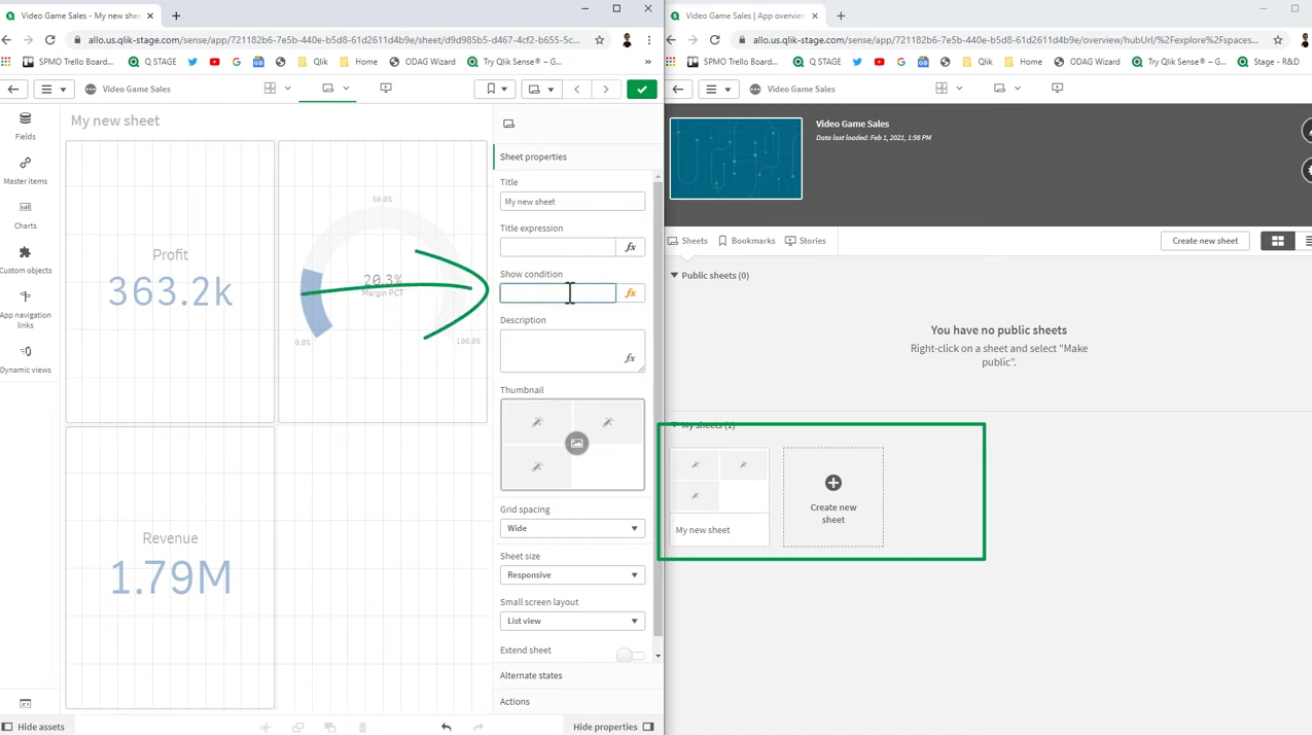
Conditional Page View
Another new advanced feature allows you to hide or show a sheet depending on specific conditions, so you can selectively adapt the experience, targeting certain groups of users in an application with specific interface pages, or activating additional pages in specific contexts or on demand.
New Visualizations
New GRID Visualization
This version brings a new grid diagram that provides an extremel efficient way to view two-dimensional measurements, being very similar to a scatter chart, but instead of correlating two measures with one dimension, allows you to view, on two different sizes at the same time, represented on 2 different axes, one or 2 measures, (one associated with the size of the points, and a possible second one on the gradient coloring of the points).
This visualization was the most often used in QlikView™ to highlight the disstribution of a relevant measure over 2 repetitive time axes (usually the time of day and the day of the week or onth).
The New Video Player Object
Notable, along with the new grid chart, is a new video player object that allows users to embed and play vidos directly in a Qlik Sense™ appllication.
The URL can be added directly, currently supporting mp4 streams, webm and ogg formats.
Please note that in this view option the URL can also be an expression, so it can be dynamic.
Reload Button, Now Native in Qlik Sense
A new action for reloading data has now been added to the set of possible actions in Qlik Sense™, so a reload button can now be included in the Qlik Sense™ application interface, allowing you to perform fast data reloads without entering edit mode again, giving users the option to reload data on demand (where it makes sense).
Extended Augmented Analysis
Qlik™ brings significatn improvements to augmented analysis capabilities in a varety of areas. For starters, search-based analysis has been improved, providing analysis of changes over time, Insight Advisor will now generate multiple charts for a single type of analysis, such as the response with data analysis between two data periods through a combination of 2 diagrams.
Also, the visual diagrams generated by Insight Advisor Search now have a new option to view narrative information and interpretations of data using natural language.
You will also find conversational analytics enhancements provided by Insight Advisor, including tracking suggestions for our users that lead to additional analytics and information, along with contextual awareness enhancements as you explore data sets. It will ot only show the sales summary, but will also provide additional suggestions and options to contribute to further analysis and information.
Overall User Experience
Now you can customize and prioritize !
Users can now customize their hub landing page to specify the data groups that are the most relevant to them, with the ability to visually manage the order in which they appear. At the same time, a standardized toolbar has been added, providing consistent navigation, interaction, structure and language within the Cloud experience.
Improved Data Connectivity
Data Catalog Integrated in Qlik Sense SaaS™*
*In progess in the following weeks
If we access a dataset we can now see additional properties and attributes, such as modification date, creation date, owner space size, creator real name, etc., as tags. There is also a section for future developments, which will be able to bring new properties and functionalities regarding the specifics of GDPR, HPPAA, or in the payments and cards industry, for example.
You can also view various metadata and statistcs of the data set, such as column names, their data types, distinct values, number of distinct values, number of null records, sample values, etc.
You can choose the columns to be viewed and also assign a name to the dataset, so that the dataset can be identified in the desired application will be developed, with views and analyzes.
New and Improved Connectivity to SAP BW
As with every release, Qlik™ aims to expand connectivity, and with this release, customers can upgrade their SAP environment. End-to-end Qlik™ SAP solutions can help customers to accelerate their data upgrades and Cloud initiatives, as well as discover more information from their SAP data.
Qlik™ launches exendedd SAP connectivity in Qlik Sense SaaS™, adding value to end-to-end SAP solutions. SAP connectivity is strengthened, basically the new SAP BW connector combines information providers and BEx connectors, providing additional value to existing SAP solutions in the beneficairy’s portfolio.
The new SAP BW connector in the Qlik Sense SaaS™ environments updates and merges existing SAP InfoProviders connectors and BEx connectors that are curently available in the Qlik Sense Enterprise OnPrem™ space.
The connection is defined using common SAP connectivity parameters, such as host client ID, system number, and password, including potential adjustments to the default values for the connection string parameters, and when connected, there are filtering options in definition to select basically type of data, such as upload text and upload attributes, to display friendly names. There is also a drop-down list for the types of providers that shows the available information providers and the BEx query selection options available.
New ODBC Connector for Amazon Athena
A new connector for Amazon Athena has also been added and SSO support has been enhanced to now have the option to store credentials separately from the data connection and apply user-specific credentials.
For a brief overview of the new features brought by Qlik™ February 2021,
you can also watch this 5 minutes video.
For more details you can access Qlik™ Product Innovation Blog or you can register to the next Qlik™ Insider Webinar.
You can find the installation package for each product on the Qlik™ Downloads page along with the corresponding launch instructions.
Please follow the best practices when upgrading any of these platforms – read the instructions in this release, back up your environment, and test the upgrade in a QA environment.
For information on the strategy and direction of the Qlik™ products, you can visit the page qlik.com/roadmap.
Qlik Sense SaaS™ will have a continuous launch cadence, with new features added throughout the year. We’ll keep you posted as these new feature are released. There is also a new section in Qlik™ Help.
For QQinfo solutions, please visit this page: QQsolutions.
For information about Qlik™, please visit this page: qlik.com.

