QQworkload™ offers in a graphical and interactive way, valuable informations for management about the effort and efficiency of the employees and departments activities, including employees’ productivity in finishing their responsabilities. The solution handles also interruptions in running activities, as well as restarts of the interrupted or pending activities. Although it starts from a quantitative evaluation, the visual information offers immediate quantitative references, as well.
QQworkload™ can be used together with QQwork.logger™ or it can use as data source any other time sheet software, time-trackers, or BPM systems.
Here are some of the broad perspective views of the solution.
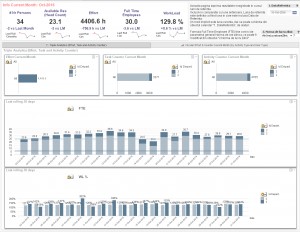
In this view, we can see the team loading, measured both in a percentage of available time and in Full Time Employees too, for which is used a standardized working hours in a day value (editable).
There are also displayed the results distributed in time by subunits, or by types of activities.

In this version of a dashboard, the current month results are compared with the previous ones.
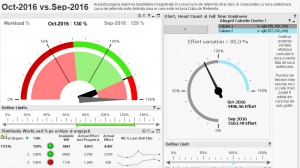
The references for overload, underload and also the colors used to signal these extreme situations can be redefined by the user, using cursors.
Each of the last 2 months workload (%) is visible, but also detailed values for departments/persons/etc. On the right addition info is provided evaluating the actual growth of the effort between the last two months.
Other references (either targeted or using previous actual results of various periods) can be used.

On top of the quantitative assessments of the performance (effort required to solve various issues), additional qualitative and quantitative analytics can be added, regarding duration of solving issues versus established references (SLA = Service Level Agreement).
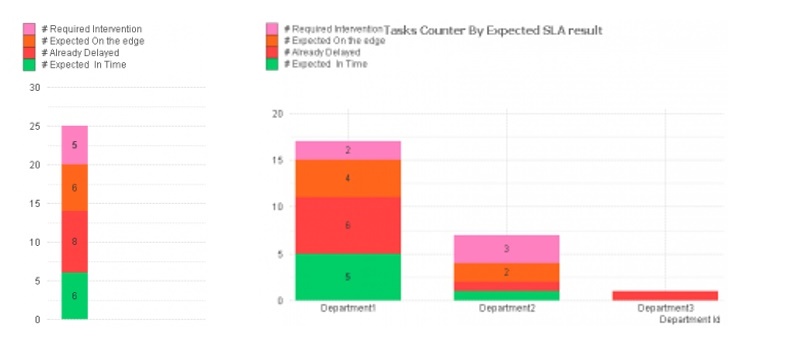
Following is a small operational dashboard, that identifies the number of situations in which the SLA will or will not be respected.
Beyond green and red that are usually associated with the good and the bad, we added pink, for situations that require immediate management intervention to prevent SLA breach, and orange, for situations identified to be on the edge.

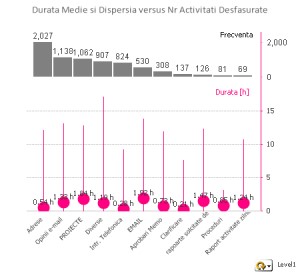
To analyze the quality of the processes and the consistency for the running activities, we propose an additional analysis that identifies the frequency for each type of activities (the gray bar), simultaneously with the execution average (the magenta dot) and the distribution limits (the magenta lines) of the effort (evaluated for each activity type/category).
Small variations around the average signals a well managed process, while a wider variation might be a risky situation, requiring additional attention

QQworkload™ provides also analyzes for evaluating the quality of the data collected from the time tracking system. These can highlight potentially fictive or altered data reported by employees.
Here are some general perspectives of the data quality assessment, but the analysis can drill-down to the level of individual reporting entries of one person or toward middle-level department perspectives.

For QQinfo solutions, please access this page: QQsolutions.
For information about Qlik™, please visit this site: qlik.com.
If you are interested QQworkload™ product, please fill in the form here.
In order to be in touch with the latest news in the field, unique solutions explained, but also with our personal perspectives regarding the world of management, data and analytis, we recommend the QQblog !