Qlik isn’t just a pretty (inter)face — it’s built for exploration and discovery so you can take action on those findings.
Dive in and intuitively explore your data to uncover hidden insights and drive smarter decisions in seconds.
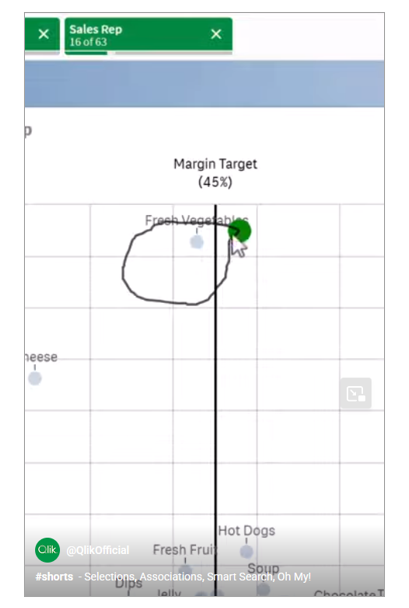
In this article, we present you a short example about how to identify the performance of some sales representatives.
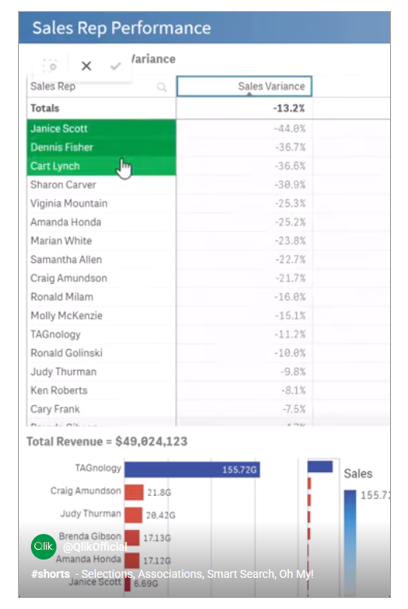
If you want to see the lowest performing sales representatives fast, and you don’t know where to start, just type in “low” into Qlik Smart Search and find low performer. One click updates everything.
If you are focused on just certain representatives, you can sort the table, by selecting those ones you are interested and instantly you can spot high margin products that are not selling.
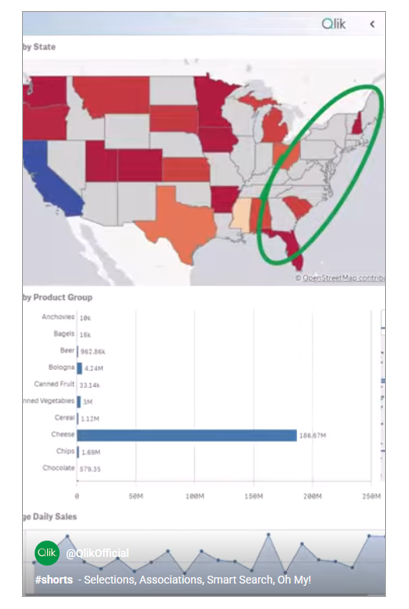
If you switch to a map view, you see those representatives are missing in an area.
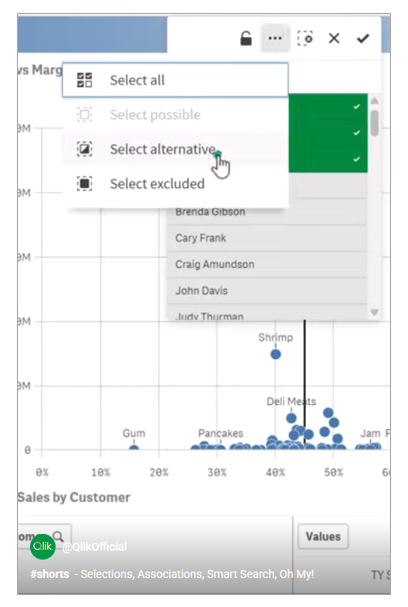
Viewing the alternative of low performers shows others are doing well there, selling more of some products.
In seconds you found three clear actions that can help those representatives, thank to associations in the data found by the unique Qlik engine.
What’s the fastest insight you’ve ever uncovered using Qlik?
For information about Qlik™, click here: qlik.com. For specific and specialized solutions from QQinfo, click here: QQsolutions. In order to be in touch with the latest news in the field, unique solutions explained, but also with our personal perspectives regarding the world of management, data and analytics, click here: QQblog !
This website uses cookies to improve your experience. We'll assume you're ok with this, but you can opt-out if you wish.AcceptRejectRead More
Privacy & Cookies Policy
Privacy Overview
This website uses cookies to improve your experience while you navigate through the website. Out of these, the cookies that are categorized as necessary are stored on your browser as they are essential for the working of basic functionalities of the ...
Necessary cookies are absolutely essential for the website to function properly. This category only includes cookies that ensures basic functionalities and security features of the website. These cookies do not store any personal information.
Any cookies that may not be particularly necessary for the website to function and is used specifically to collect user personal data via analytics, ads, other embedded contents are termed as non-necessary cookies. It is mandatory to procure user consent prior to running these cookies on your website.