Earlier this year, Qlik™ has introduced business glossary capabilities to all of Qlik™ Cloud Analytic customers. Built upon the Qlik™ Cloud Catalog framework, users have been able to access a single, easily-accessible repository of business terms and descriptions. This ensures that everyone in the organization has the same understanding of key business terms.
This week Qlik™ has added a welcomed improvement to the Business Glossary available in Qlik™ Cloud. The Business Glossary improves internal communication and eliminates confusion by ensuring that the same business terminology is used across the entire organization. Terms that are defined in a Business Glossary can now be linked to Measures and Dimensions in the Master Items library ensuring consistency. AND once defined this information is available for users to view and access directly from the information pop up windows either in edit more or in analysis mode. Streamlining data-based decisions by eliminating misunderstandings due to competing terminologies or inconsistencies between technology definitions and business language.
Qlik™ has now expanded these capabilities in terms of visibility and associated objects.
Associate term with master measures & dimensions

You can already define which apps and datasets are related to a term in the business glossary. Now Qlik™ has expanded this relationship-defining capability to master Items. When you create a new master measure or dimension, the user can now also define which terms relate to that master item.
As you’ll see, having this connection can enable any analytic user to better understand the data they are looking at.
Pop-up term definition
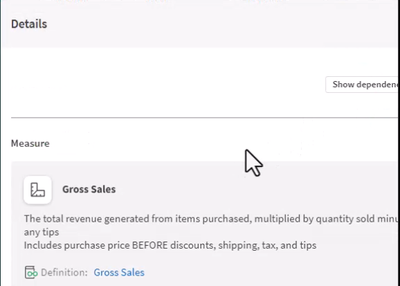
This makes it easy for any user to better understand the data they are looking at. It also helps data stewards ensure that everyone in the organization is speaking the same “language”.
Glossary links within Lineage Summary View
Another way Qlik™ has made it easier for users to better understand any business terms that are used in a chart is by enhancing the lineage summary view. This is an optional view, available with most chart types, that gives users an explanation of the data used within the chart along will links to the data’s lineage. A link has been added to this view for glossary terms that are used within the chart.
For a brief demonstration, please watch the video clip below:
For information about Qlik™, please visit this site: qlik.com.
For specific and specialized solutions from QQinfo, please visit this page: QQsolutions.
In order to be in touch with the latest news in the field, unique solutions explained, but also with our personal perspectives regarding the world of management, data and analytics, we recommend the QQblog !