Data alerting in Qlik Sense Enterprise SaaS™ provides sophisticated data-driven alerts that help users more proactively monitor their business and take timely action. Intelligent data alerting capabilities include advanced statistical calculation and trending that notifies users of sudden changes or outliers in data. Alerting is included within the Qlik Sense Enterprise SaaS™ user interface, allowing both self-service and managed alerts.
* Users can create custom alerts for themselves, focusing on data that meets specific business conditions (any Qlik Sense SaaS™ licensed user).
* Users can assign recipients for their alerts (requires a Qlik Sense SaaS™ Professional license).
With data alerting in Qlik Sense™, organizations can more proactively manage by exception, notifying users of potential issues and allowing them to immediately analyze further, prompting timely action based on insight. Alerting is included in the Qlik Sense Enterprise SaaS™ (on Cloud) version and requires additional licensing for Qlik Sense Enterprise Managed™ (On Premise).
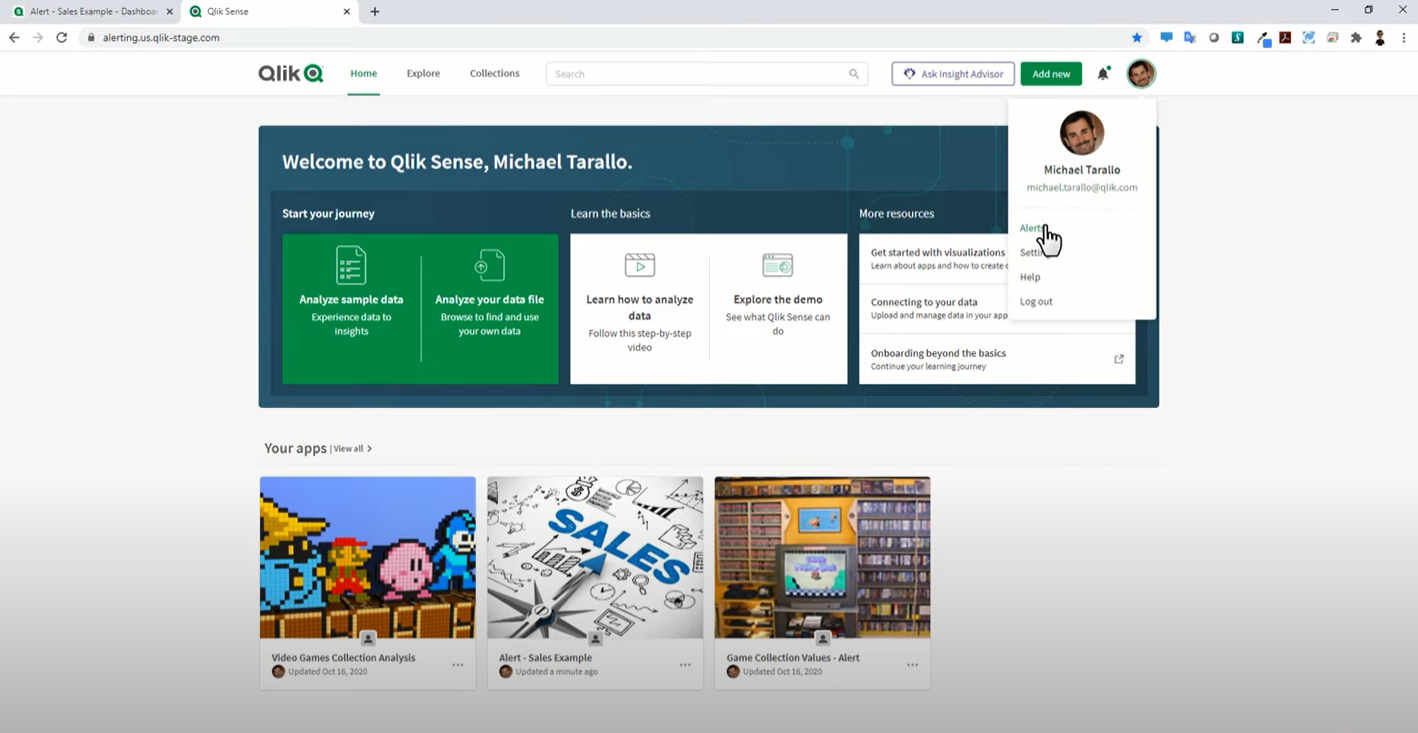
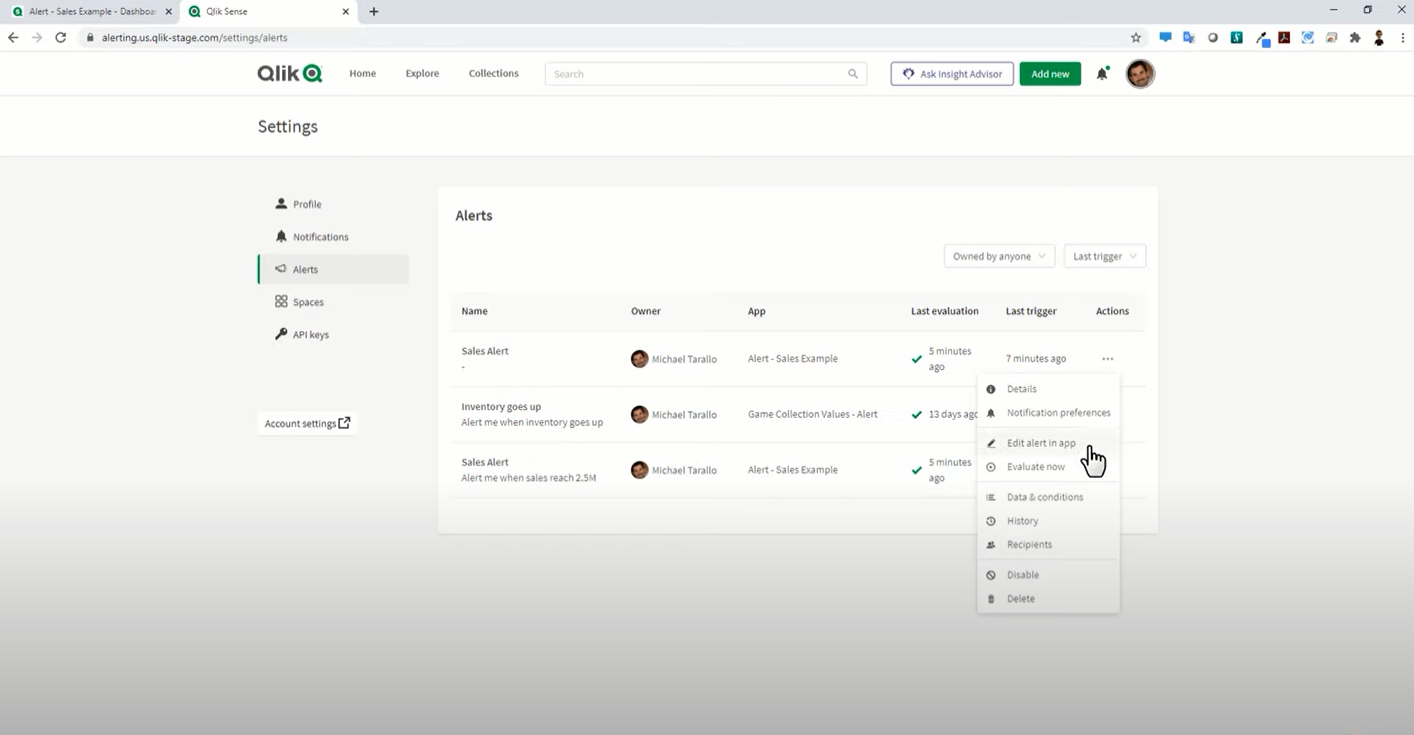
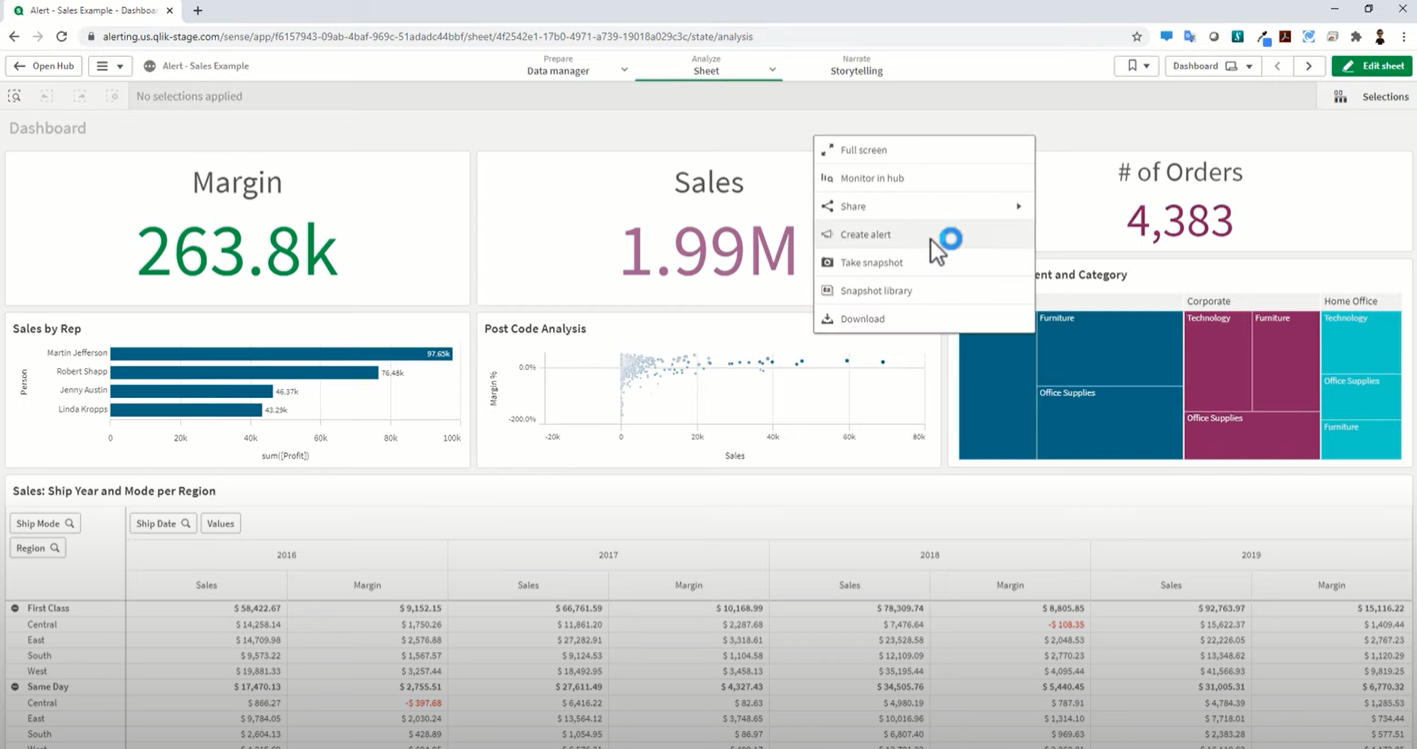
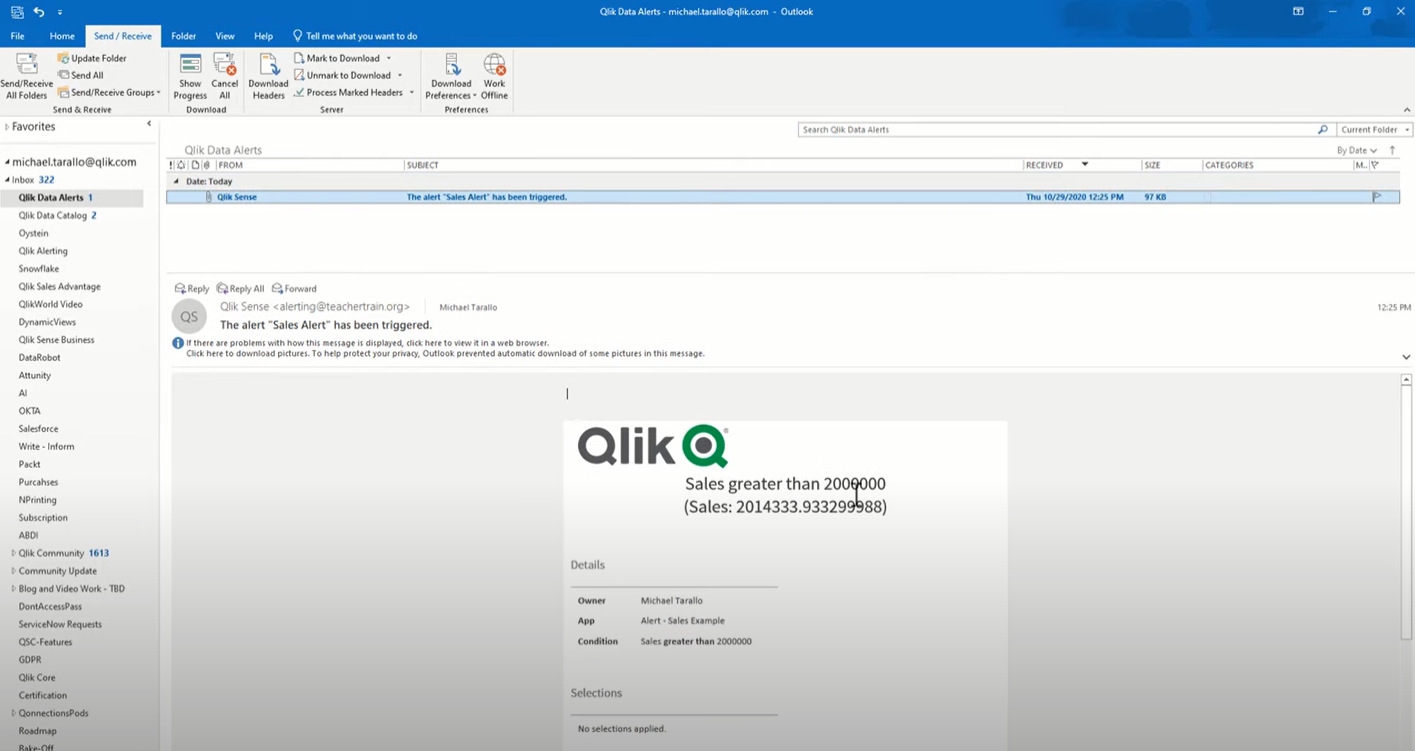
1. You can find some examples regarding the Qlik™ Data Alerting interface below.
2. Here you can identify alerts in Qlik Sense SaaS™ Hub 3. The list of defined alerts also allows you to enter the app whose alert you have defined 4. You can add alerts directly from the app interface 5. Example of alert received by email
2. Productivity, user and visualization improvements
Images in Custom Tooltips
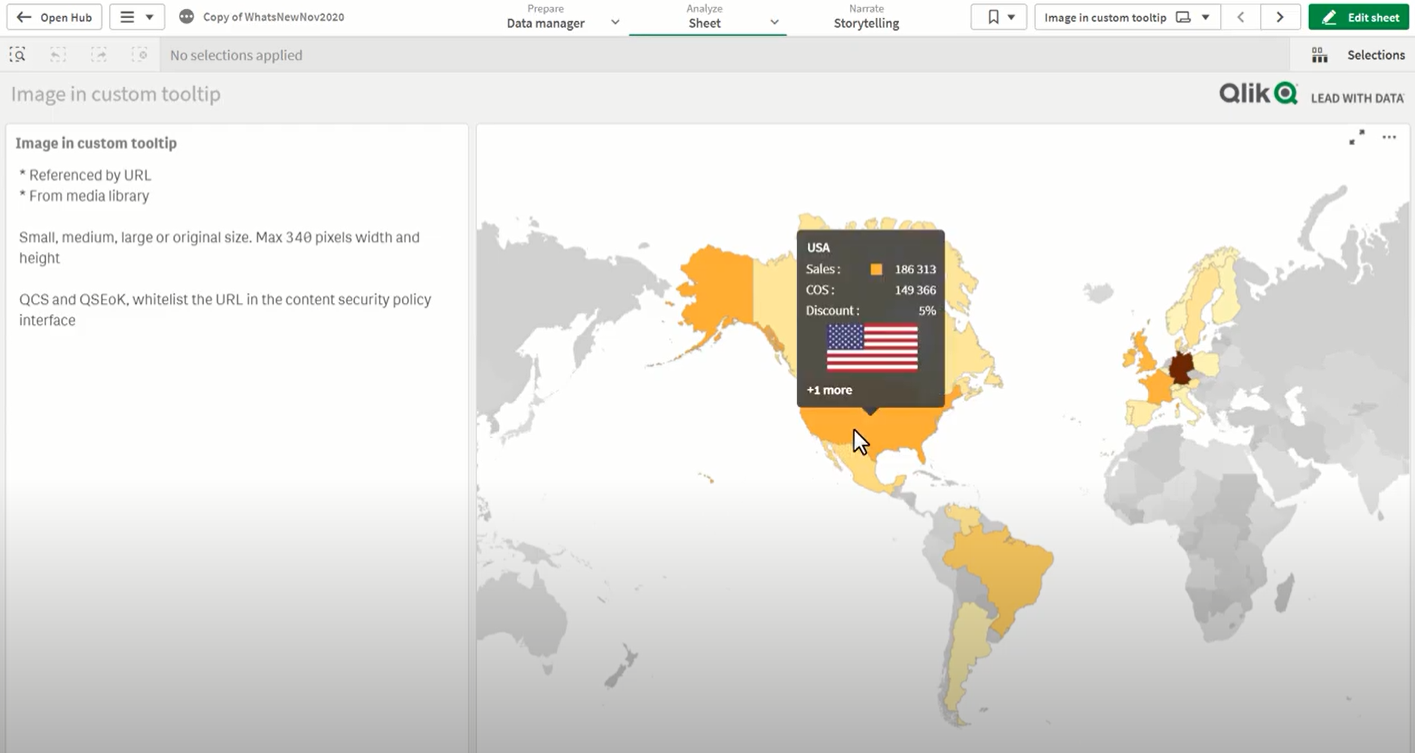
Users can now load custom images in tooltips for more styling options which activate when you mouse-over. They can feature an image from the media library or reference one by a URL. This offers further flexibility and enhanced options for app development, as images are a great way to provide additional context when hovering over an object.
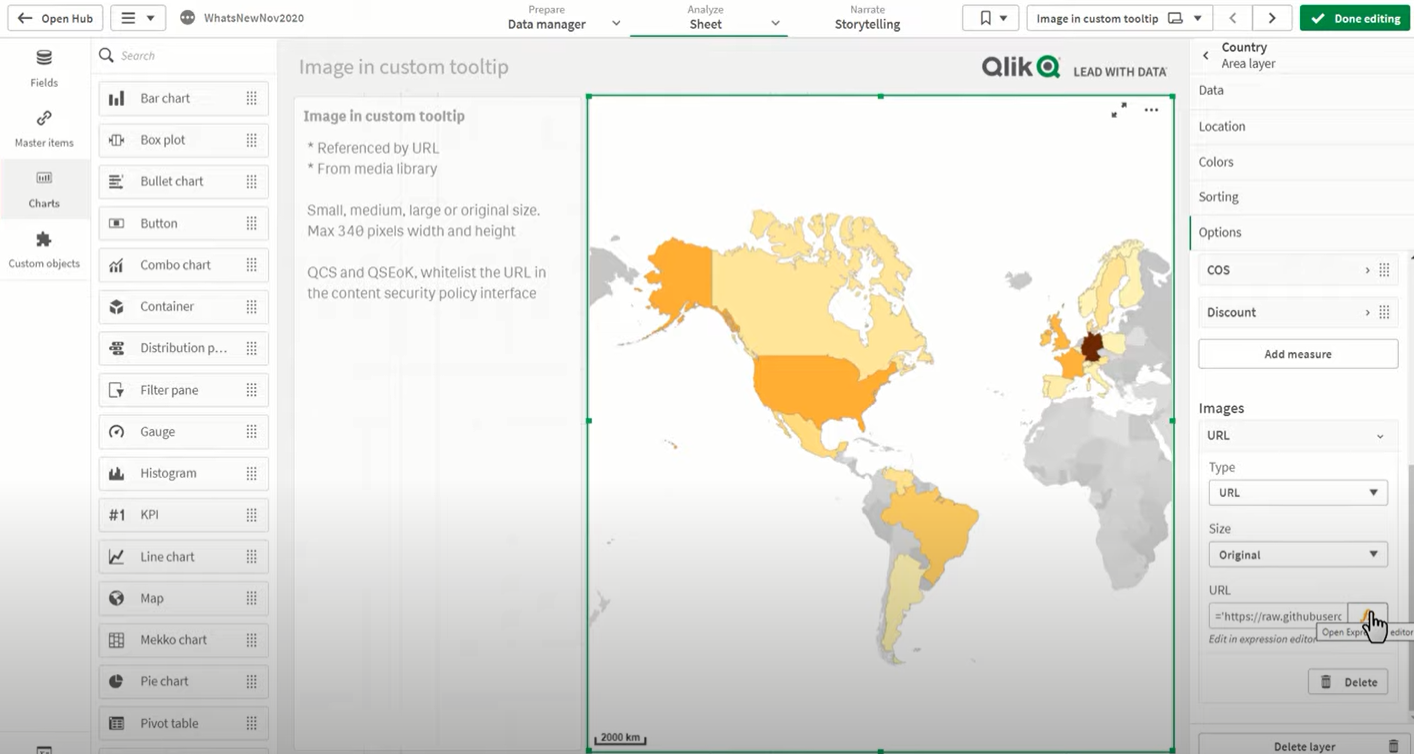
1. Image with the country’s flag that appears when we bring the mouse over the respective country in a Qlik™ map 2. Example of the option to add an image via a specific dynamic URL
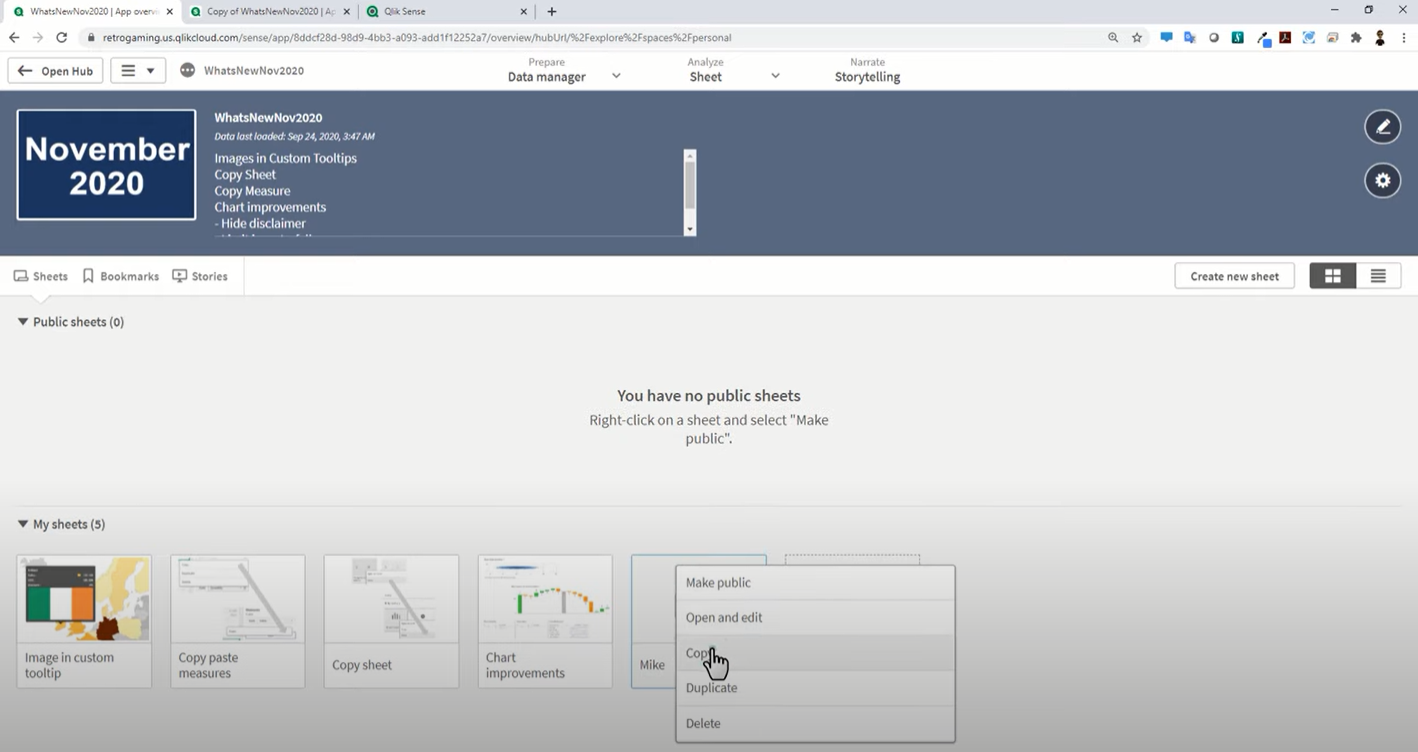
Copy sheets between apps
Users can now copy sheets between apps to improve productivity for power users and application developers. This is a highly requested feature from our customer base, as it drives greater faster time to insights across the organization. This has been a highly sought after feature on our part and that of our customers, as it provides a shorter time to deliver analysis and information throughout the organization.
(QQinfo is, de facto, one of the first Qlik™ partners to send this request to them and we are glad that we were listened to and that Qlik™ solved it).
Copy measures between objects
Another feature to speed app development, users can quickly copy measures between charts. This is a small, but powerful feature enhancement that drives faster insights within an organization.
Additional chart improvements
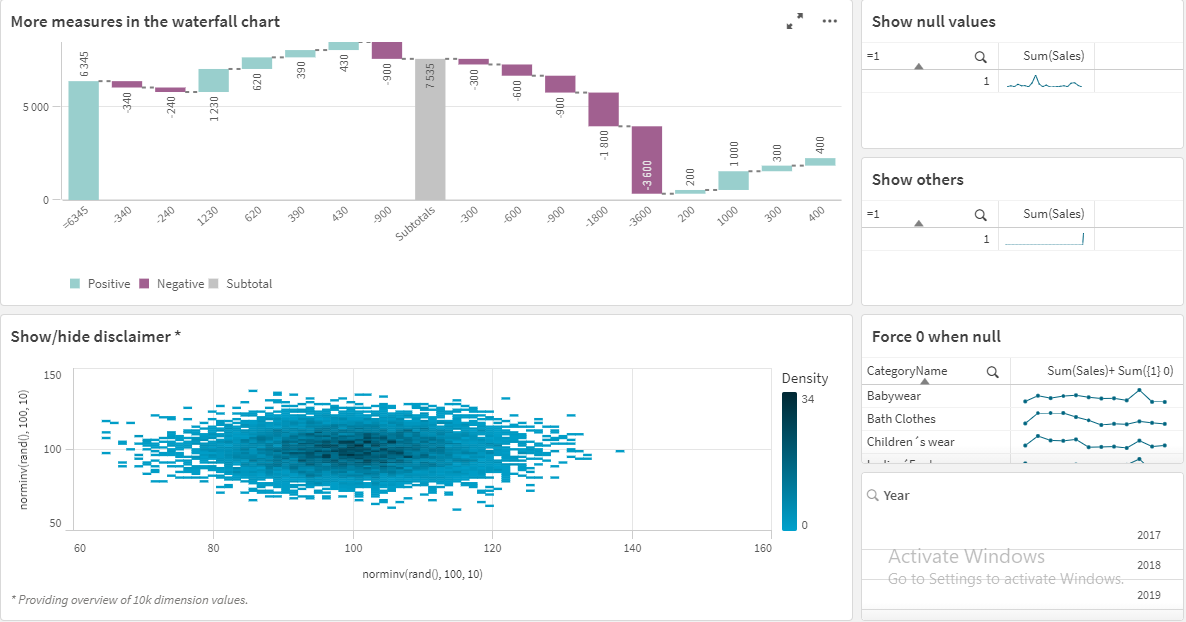
– The ability to hide disclaimers in charts; a user can now decide whether the disclaimer for additional data points should be visible or not – Increased measure limit in the Waterfall chart, now supporting 50 measures (from 15) – Extended functionality in table mini charts, including others, and null
3. Augmented Analytics
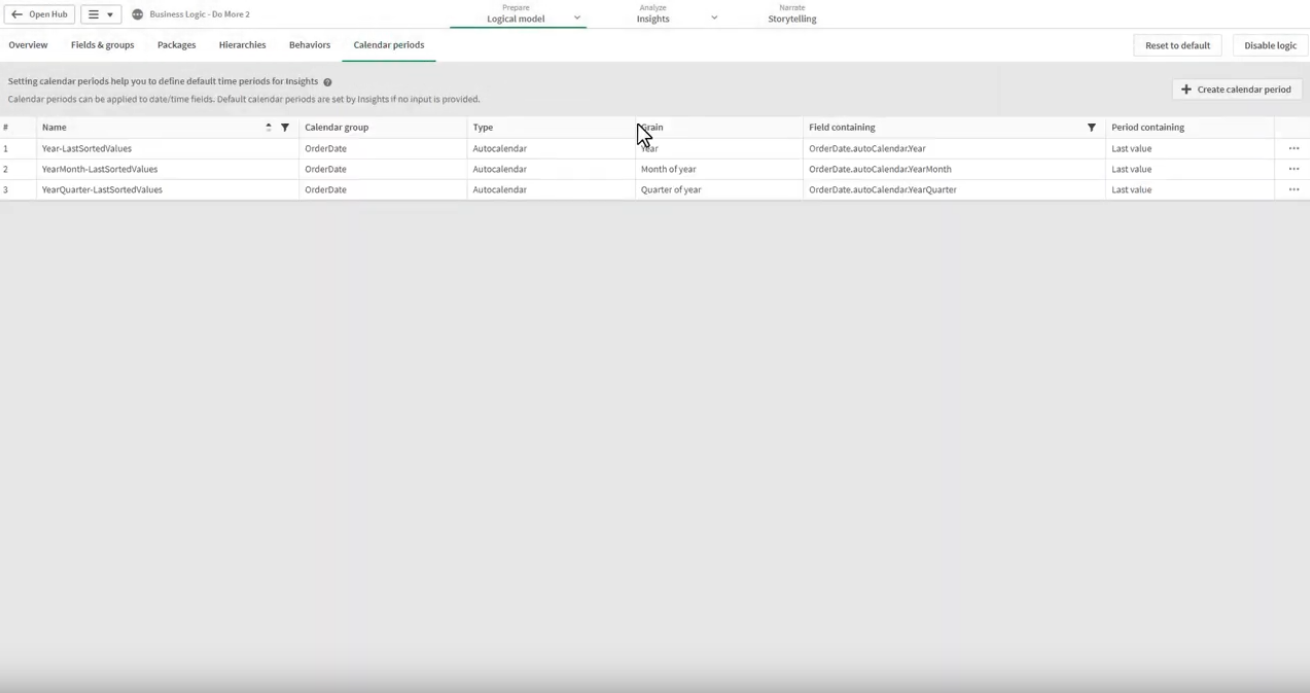
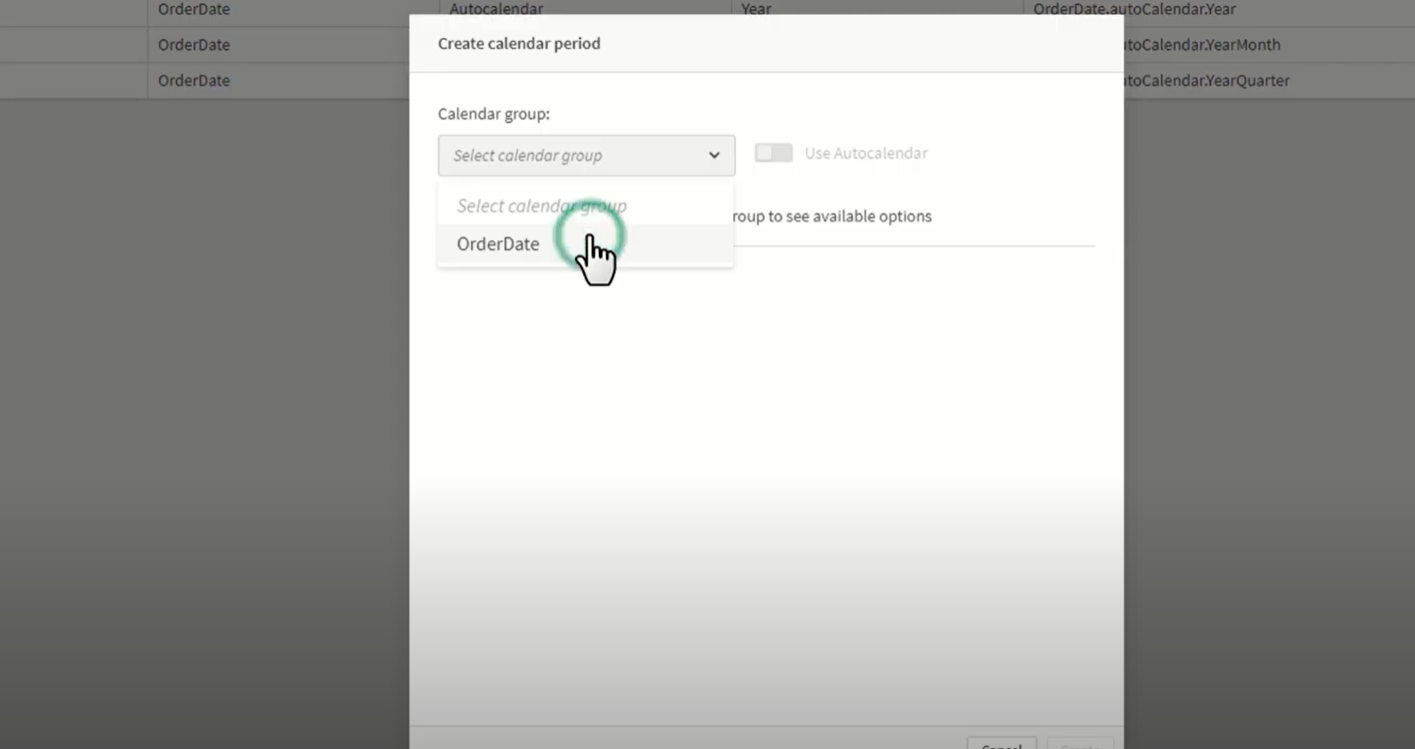
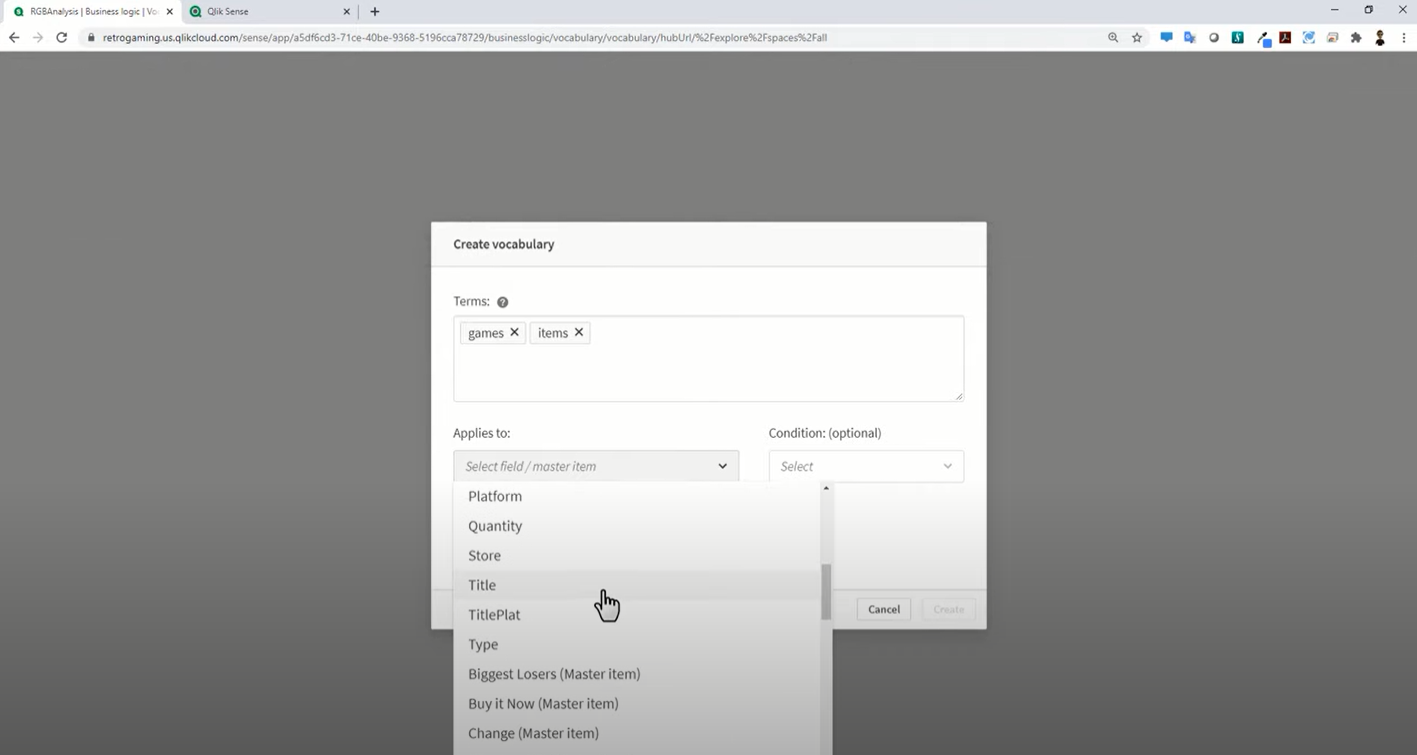
Business Logic – Default Analysis/ Calendar Periods
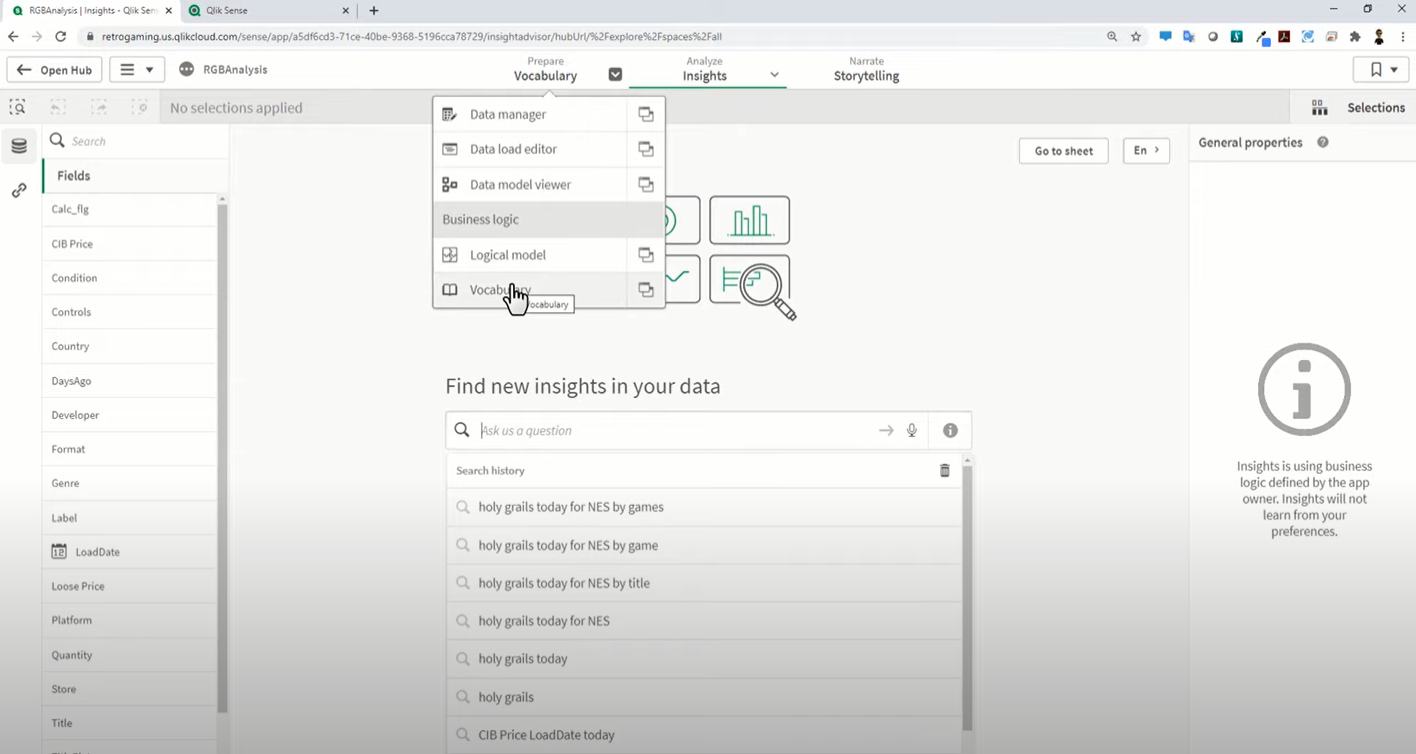
Business Logic now includes the ability to define default calendar periods for analysis, such as last year, last quarter and last month. When defined, these periods will be automatically applied by Insight Advisor to deliver the most relevant results for time-based inquiries. In addition, this also supports period-over-period comparisons such as year-over-year or “this month last quarter”, delivering more relevant results for these comparisons. And, they can customize natural language processing, including defining vocabulary rules and synonyms for more natural interaction.
Insight Advisor Spike Detection
Spike Detection Analysis Type
Insight Advisor now features automatic outlier detection. It identifies spikes and drops in your data using sophisticated algorithms and exposes these outliers as results through search-based analysis. This valuable capability allows users to stay informed and act in real-time when there is an anomaly. More outlier types are planned in the future.
4. Client-managed/ multicloud- Windows Hub Improvements
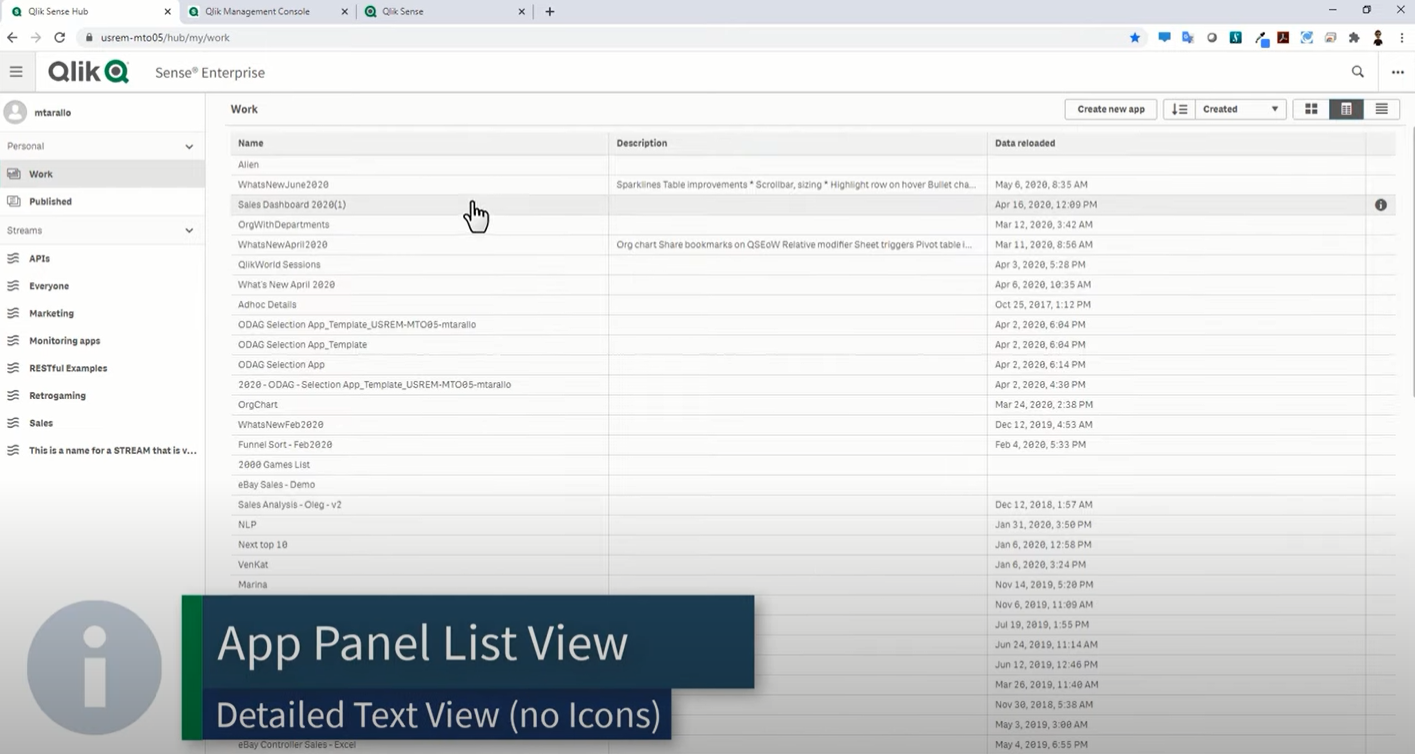
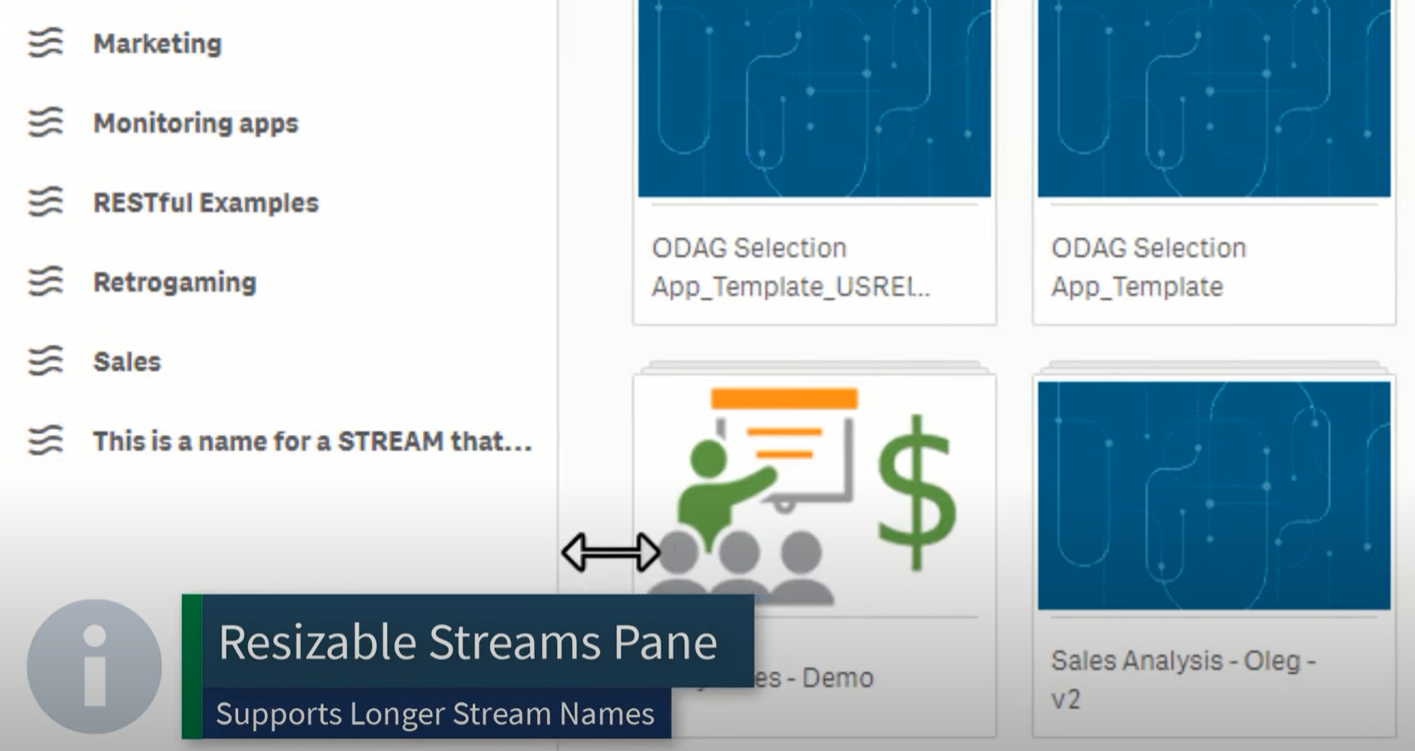
Resizable Streams Pame- Support Longer Stream Names
App Panel List View- Detailed Text View (no Icons)
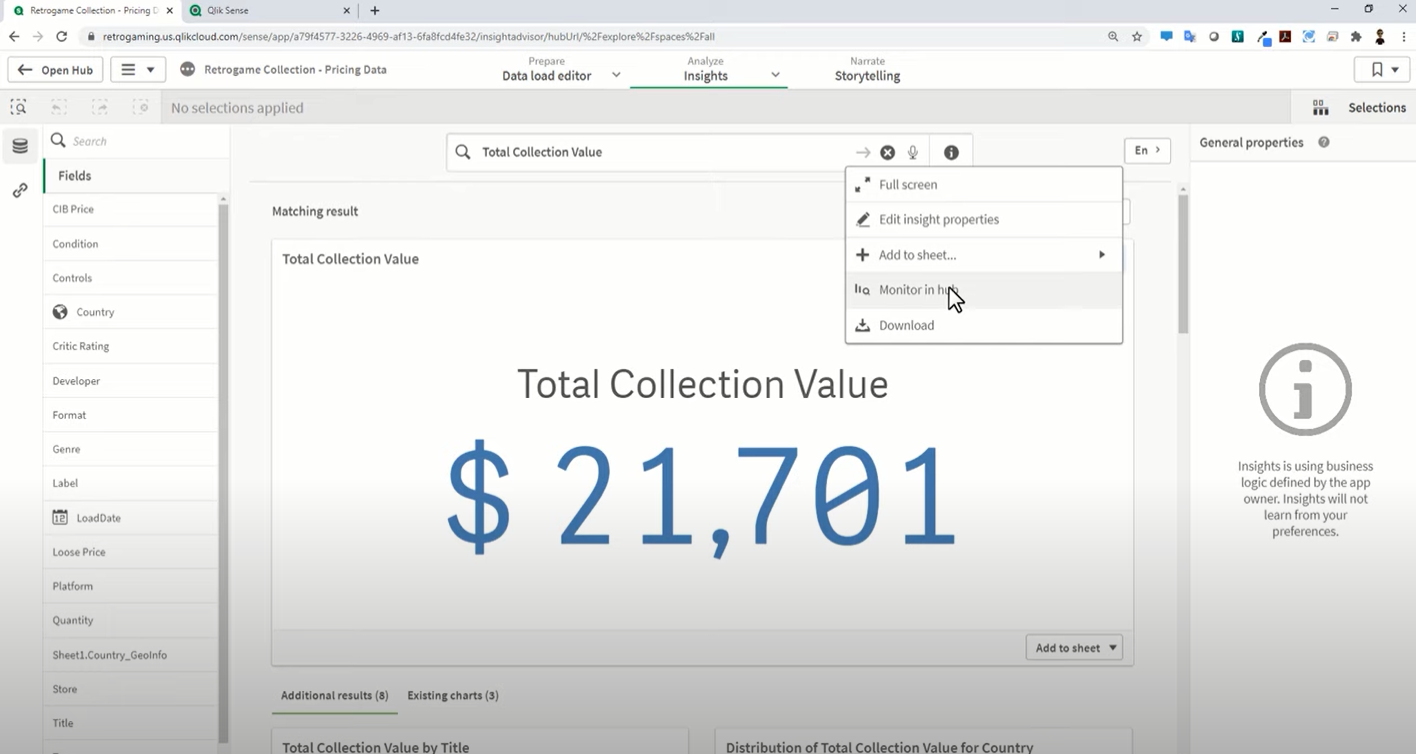
5. Insight Advisor Charts
Suggested charts can be added to Chart Monitoring for faster permanent use.
6. K-means Clustering – Expanded Functionality
K-means clustering on-board the Qlik™ Engine was released in September. – This function allows data points to be grouped into clusters based on similarity. It’s a highly useful function for customer segmentation, fraud detection, and many other use cases.
In this release, we have improved our clustering function with new capabilities, such as automatic calculation of the optimal number of clusters. This will broaden access to clustering functionality, as Insight Advisor will now auto-generate optimal cluster charts based on the data.
For demonstration of the new Qlik™ features presented above, please watch this video:
For more information about Qlik™, please follow this link: qlik.com
For QQinfo solutions, please visit this page:QQsolutions.
In order to be in touch with the latest news in the field, unique solutions explained, but also with our personal perspectives regarding the world of management, data and analytics, we recommend the QQblog !
This website uses cookies to improve your experience. We'll assume you're ok with this, but you can opt-out if you wish.AcceptRejectRead More
Privacy & Cookies Policy
Privacy Overview
This website uses cookies to improve your experience while you navigate through the website. Out of these, the cookies that are categorized as necessary are stored on your browser as they are essential for the working of basic functionalities of the website. We also use third-party cookies that help us analyze and understand how you use this website. These cookies will be stored in your browser only with your consent. You also have the option to opt-out of these cookies. But opting out of some of these cookies may affect your browsing experience.
Necessary cookies are absolutely essential for the website to function properly. This category only includes cookies that ensures basic functionalities and security features of the website. These cookies do not store any personal information.
Any cookies that may not be particularly necessary for the website to function and is used specifically to collect user personal data via analytics, ads, other embedded contents are termed as non-necessary cookies. It is mandatory to procure user consent prior to running these cookies on your website.