Qlik™ focused on new version released in September in several directions, aimed at:
- Improved Visual Analytics:
- K-Means Clustering Function
(part of the new set of advanced analysis functions – for Data Science) - Advanced reference lines and comments in line or bar graphics
- Vizualization Animator Control
- K-Means Clustering Function
- Augmented Visual Analytics Improvements:
- Insight Advisor Chat
- Business Logic
- 3 new charts available in Insight Bot
( clustering graphic / correlation graphic / control graphic)
Improvements to Views and Functions
K-Means Clustering Function
With the launch in September 2020, advanced analytical calculations from the Data Science area were introduced in the Qlik™ associative engine.
The first available functions allow grouping data into clusters, based on similarity, using K-Means Clustering algorithms. This is a valuable capability in fraud detection and customer segmentation, but also in many other cases.
K-Means Clustering allows both the identification of the belonging of each analyzed entity to a cluster, and the identification of the centroid position of each cluster, as a more synthetic representation of the entire cluster.
Clustering can be applied on a two-dimensional space, easier to understand by the human mind, or a clustering can be requested in a n-dimensional space, using the respective specific functions, as it can be seen in the image below.
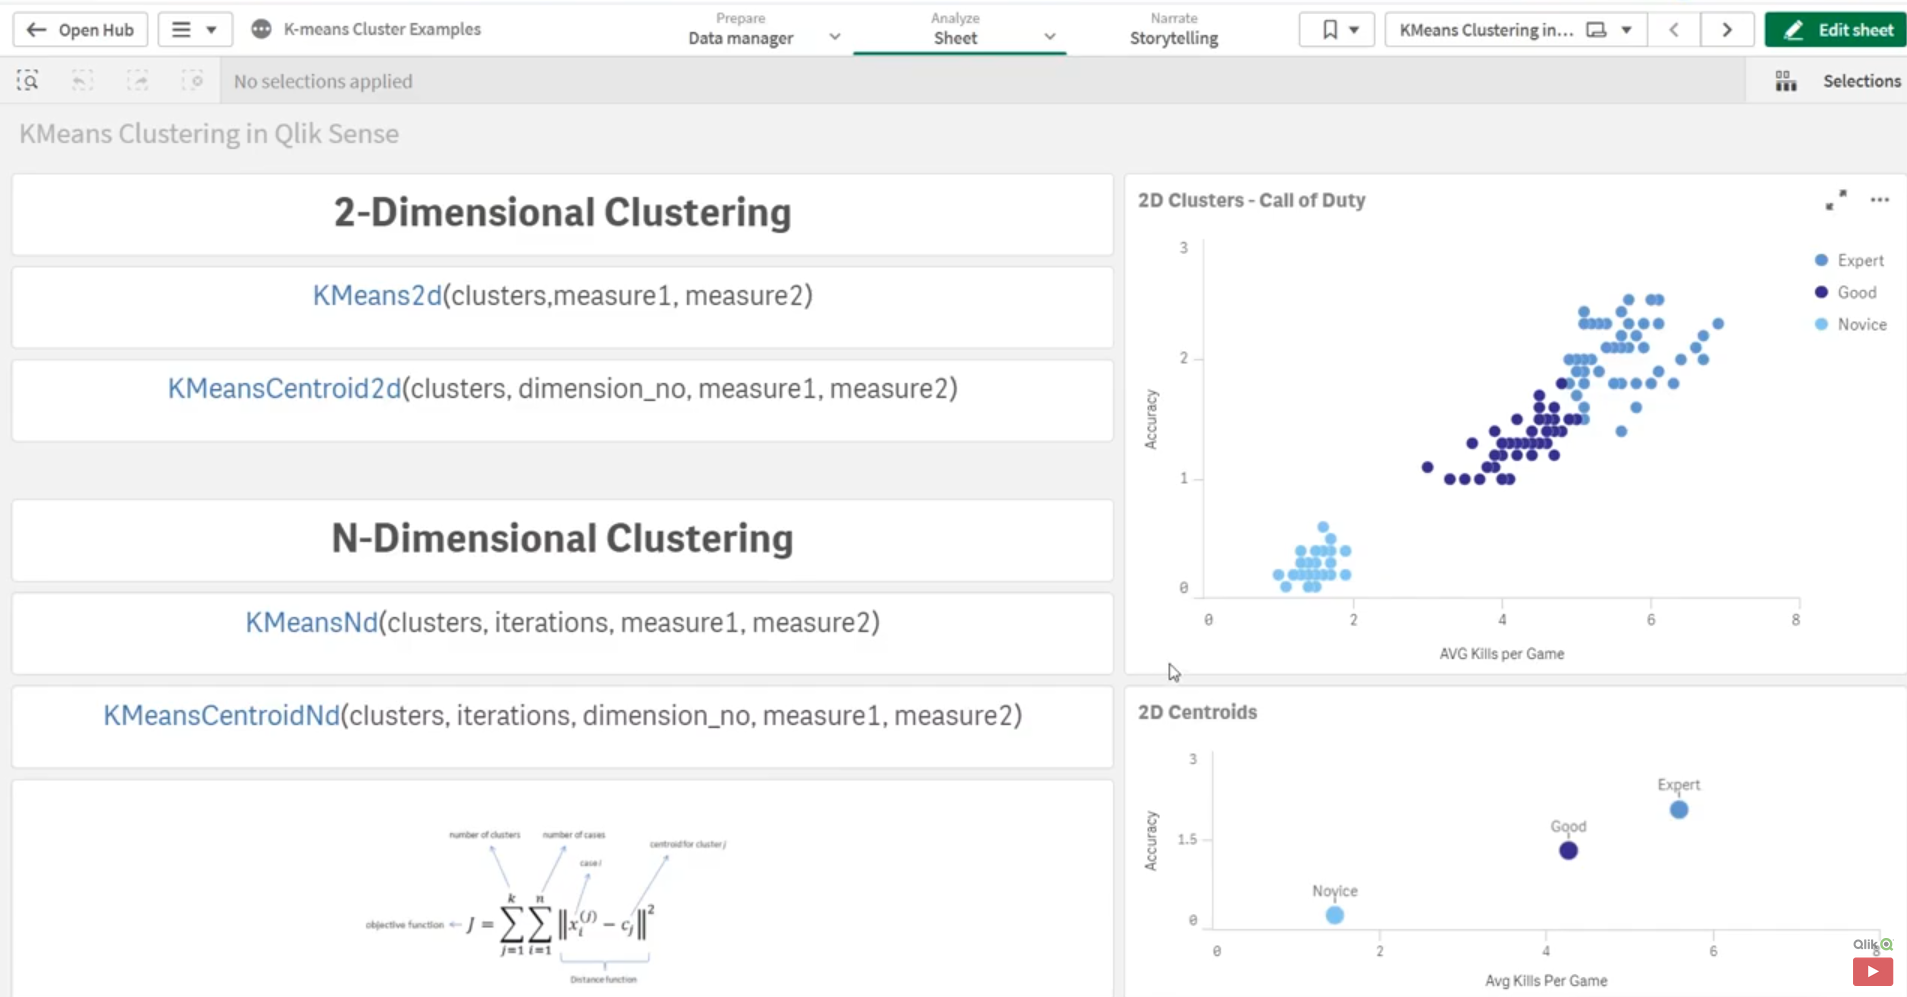
In the examples in this article we have a data cloud view (scattered cloud), in which we represented on the axes the 2 measures, and the coloring was done based on clustering in classes.
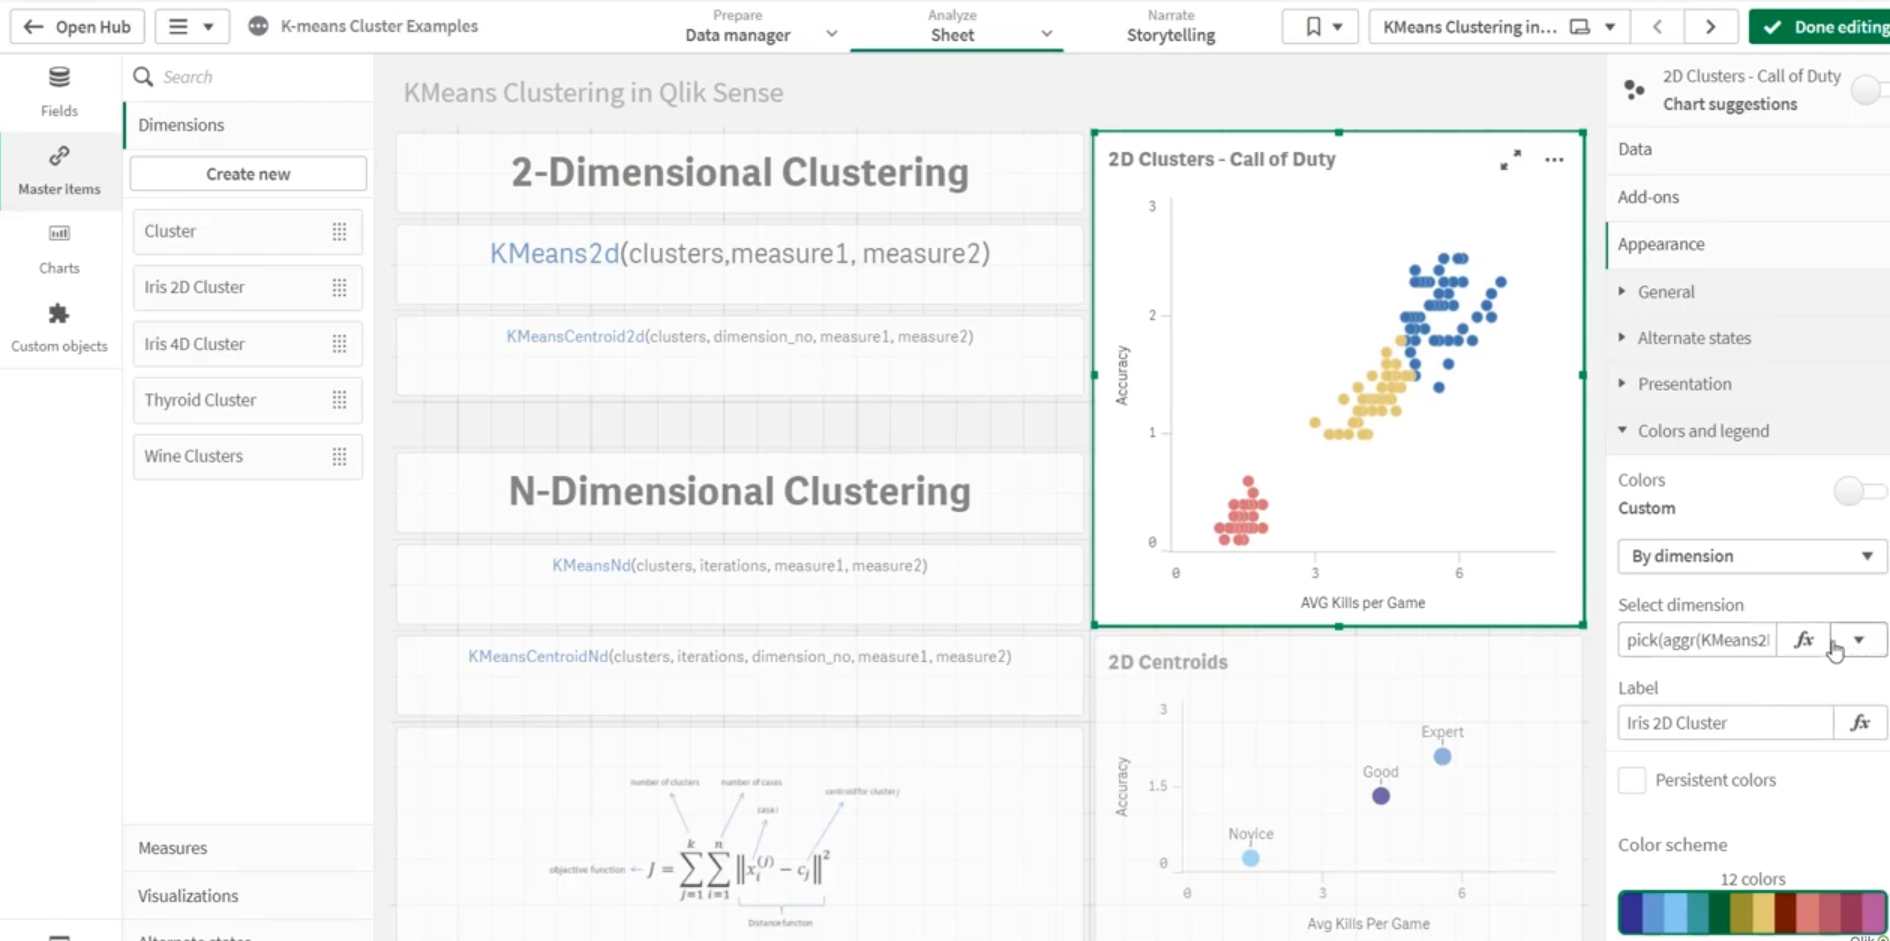
The choice and parameterization of the clustering function is done in the same way as the definition of any processing function in the Qlik interface. In this case, the coloring function chosen was:
pick(aggr(KMeans2D(3,avg(AvgKillsPerGame), avg (Accuracy)), observation) +1, ‘Novice’, ‘Good’, ‘Expert’ )
It was our decision in using the function, that we want:
- division into 3 clusters / classes,
- what are the 2 measures we want to use as references in the classification,
- as well as how we want to name the 3 classes
The editing of the coloring function can be seen (in the image below) as it was done in the editing panel of the object (right), on the coloring variant on a dimension calculated according to the above formula (Select dimension).
Note that all K-Means functions can be used in any graphical and tabular representation in the Qlik™ interface, not only in Scatter Cloud view, as we presented in the examples above.
Qlik™ has announced for the near future the introduction of several advanced analysis functions, which we will inform you about in our future articles, as they appear.
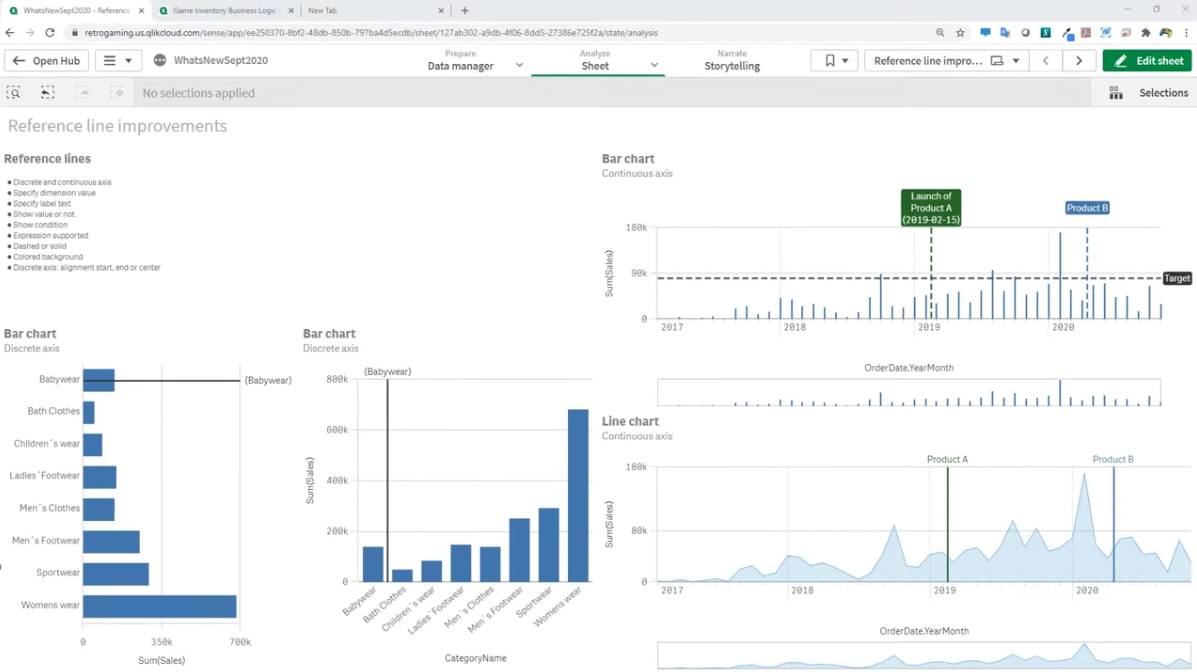
Advanced Reference Lines
The ability to include and stylize reference lines for dimensional values in line or bar charts has been added. You can thus mark dimensional elements, such as the start and end dates of important events, or other relevant references, not only graphically, but also by adding explanatory text to those references.
Visualization Animator Control
We have in Qlik Sense™ a new animation control object, which offers to users the ability to animate the evolution of data over time, defining the size on which the selection will be animated for playback in the animation loop. The animation thus created controls the display of all objects on the page. In the example below you can see how the number of customers, the value of sales, the ranking of customers, as well as how to complete the chart (bottom right) evolves as the days accumulate.
You can also control the visibility of scroll icons that appear over charts, and there are some additional formatting and styling improvements.
Improved Augmented Analysis
Qlik™ September 2020 places a strong emphasis on Insight Advisor’s capabilities, bringing enhanced augmented analytics capabilities delivered in the new Insight Advisor Chat and Business Logic dynamic search-based visual analysis features.
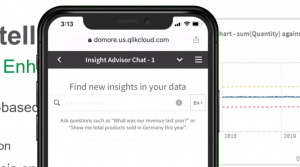
Textual search-based analyzes have been improved. In a Qlik Sense™ application you can immediately get answers to business questions, using natural language with the help of search-based analysis, Insight Advisor will automatically generate the most relevant views and analyzes for the user, based on natural language processing. With each release, Qlik continues to add more advanced capabilities to address new use cases.
Also, worth noticing is a new native conversational analysis experience for Qlik Sense™, already available in Qlik Sense™ SaaS starting in September 2020: Insight Advisor Chat.
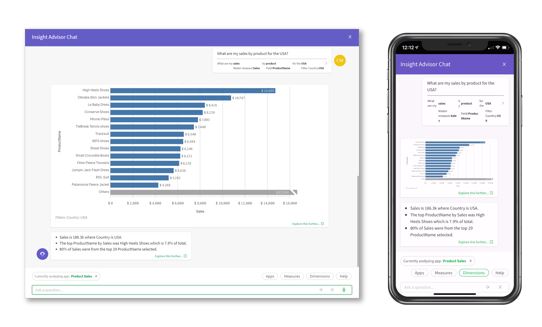
In the same context, but on small format mobile devices, it is possible to generate visual analysis based on text when using the Qlik Sense™ Cloud browser interface.
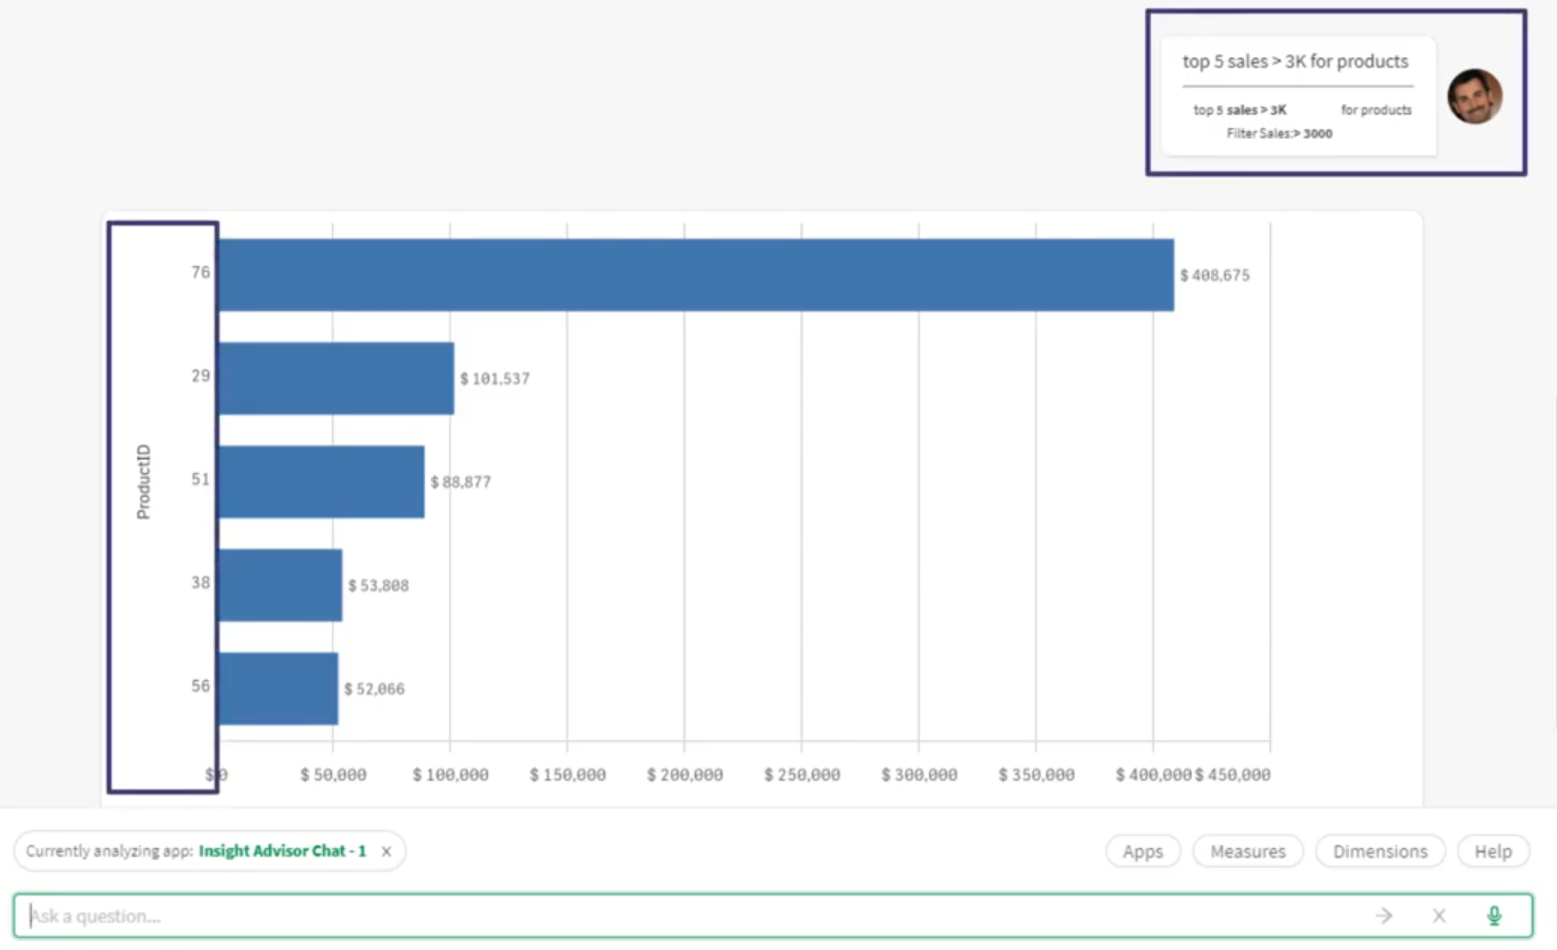
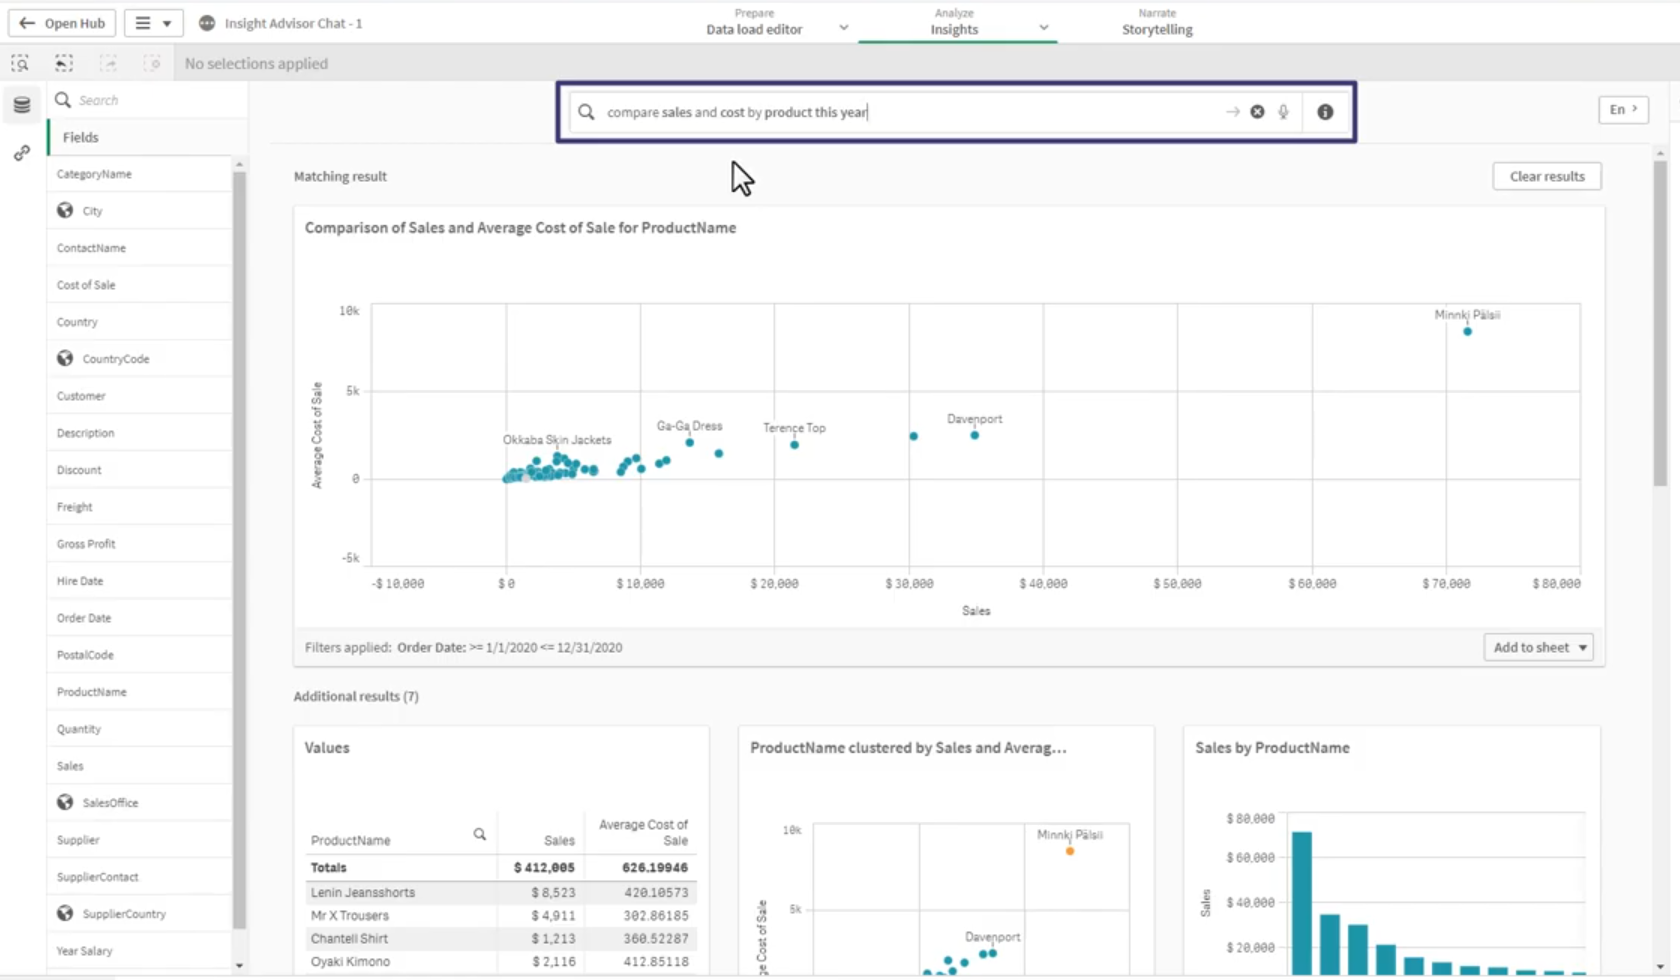
Insight Advisor Chat is a functionality that offers the interpretation in several languages of natural language, the user’s intention and starting from them, the creation of a perspective of visual analysis of the data. Simultaneously, a narrative text of the relevant observations automatically extracted by the conversation engine in the respective context is automatically created.
Insight Advisor Chat is available in the following languages: English, German, Spanish, French, Italian, Japanese, Dutch, Brazilian Portuguese, Russian, Swedish, Simplified Chinese, Polish, Turkish, Korean and Traditional Chinese.
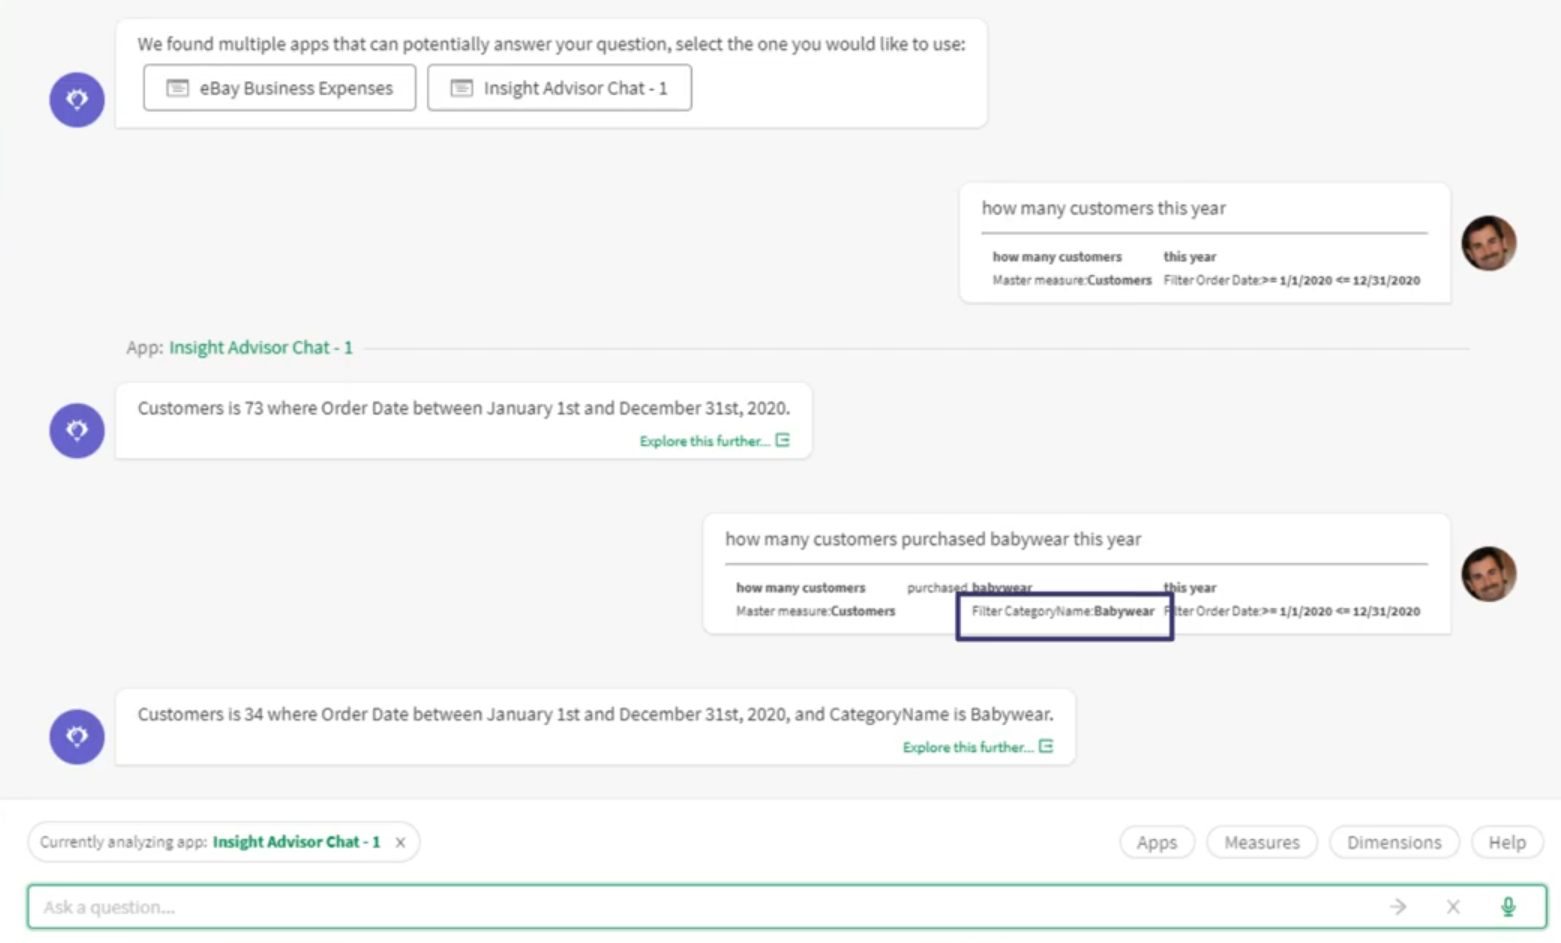
Users can access visual analytics starting from a direct conversational text search in the Qlik Sense™ Cloud HUB, identifying not only graphics of interest but also the applications that these graphics are part of, allowing the management to find appropriate information even if it doesn’t know exactly where to look. Insight Advisor practically it shows you the way as a smart assistant!
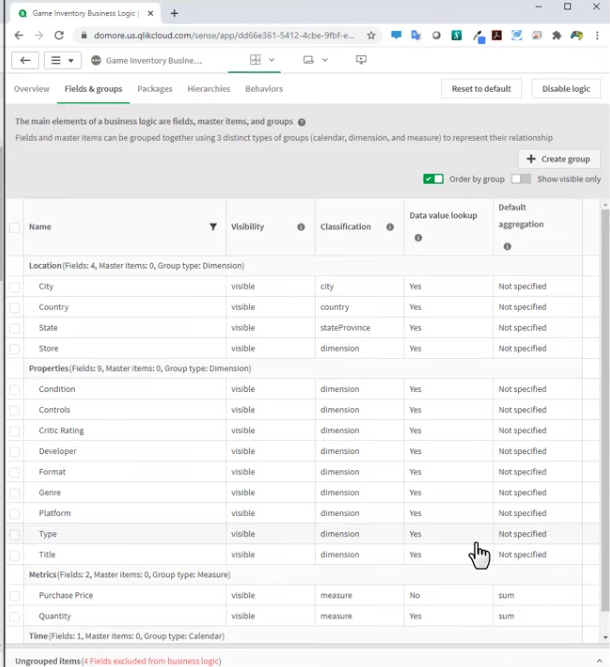
To expand the interpretation capabilities of Insight Bot, Qlik Sense™ Cloud September 2020 also introduces a new concept called Business Logic.
This new capability allows you to define new rules and metadata for understanding specific business terms (including in Romanian!), to customize and guide the behaviour of Insight Advisor, when users generate insights and conversationally interact with it.
Business Logic brings the ability to logically group fields, classify data, specify default behaviours, define favorite relationships, and more. Users can create a special calendar periods to define how measures should be filtered, aggregated and compared based on preferred time intervals, and can customize natural language processing, including defining vocabulary rules and synonims for more natural interaction.
Below you can also watch a 5 minutes video presentation of the previously presented ones.
For more detailed demonstrations of the news, click here: https://www.youtube.com/watch?v=HiOBJwUevs8.
For more information about this version and details about all the features, click here: https://help.qlik.com/.
To explore and download an application with the news brought in the last 3 Qlik Sense™ releases (April, June and September 2020), you can use this link: https://demos.qlik.com/qliksense/WhatsNew.
And to see an index of possible up-to-date views in Qlik Sense™, you can use this link: https://demos.qlik.com/qliksense/VisualizationShowcase.
For QQinfo solutions, please visit this page: QQsolutions.
Qlik Sense™ September 2020 is available here: Qlik download site
We recommend you to follow the best practices when upgrading to Qlik™ platforms (more details for the current version can be found here: release notes).
We recommend you to test always the new version first in a test environment !
For more upgrade guidance, please click here: Qlik Sense™ Upgrade guide
For more information about Qlik™, please click here: qlik.com.