
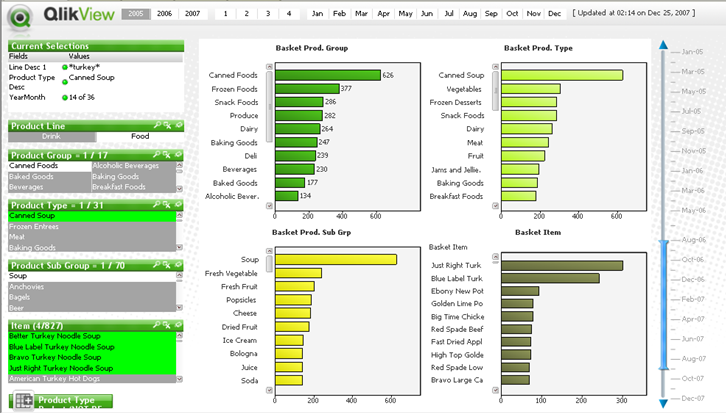
This tool highlights customers’ purchasing preferences by allowing the understanding of product combinations that appear on the same sales document (invoice/ tax receipt) and highlighting the volumes associated with all products in transactions containing the selected subset of reference products.
The most relevant filter dimensions for this tool are in the product segmentation area. But the analysis can also be filtered on different locations or groups of locations or time periods.
Also, for various industries the level of data alignment can be changed from basket level (receipt / invoice) to other levels. For example, a composite key can be used as a unit for granularization and alignment in the distribution: year, month, and customer.
For information about Qlik™, please visit this site: qlik.com.
For specific and specialized solutions from QQinfo, please visit this page: QQsolutions.
In order to be in touch with the latest news in the field, unique solutions explained, but also with our personal perspectives regarding the world of management, data and analytics, we recommend the QQblog !