macroEQ™– dynamic multidimensional analysis over Romania’s macroeconomic information.
macroEQ™ contains and presents consolidated and dynamic information about Romania’s macroeconomics (Correlation of varied information, inflation, interest rates, stock indices, internal and external debt rates, Current Course variation, Course variation in Time, etc.).
Among the main benefits of the macroEQ™ solution are:
It eliminates multiple introduction of the same information manually and offers:
an increased processing speed;
staff download;
human errors elimination.
Ensures a quick, consistent and no errors processing;
Highlights the shortcomings in data quality (generates reports and/or alerts for all predictable mismatch situations);
Offers rapid, complete, interactive and friendly access to synthesis and detailed information based solely on information and processing executed automatically ensuring transparency and verisimilitude;
Ensures a complex and objective processing for identifying the situations that need the manager's/operator's intervention;
All the information is presented mainly through graphs.
The macroEQ™ application uses consolidated free public data from the following sources:
National Bank of Romania (http://www.bnr.ro);
Bucharest Stock Exchange (http://bvb.ro);
Qlik Data Market (http://www.qlik.com/us/explore/products/qlikdatamarket).
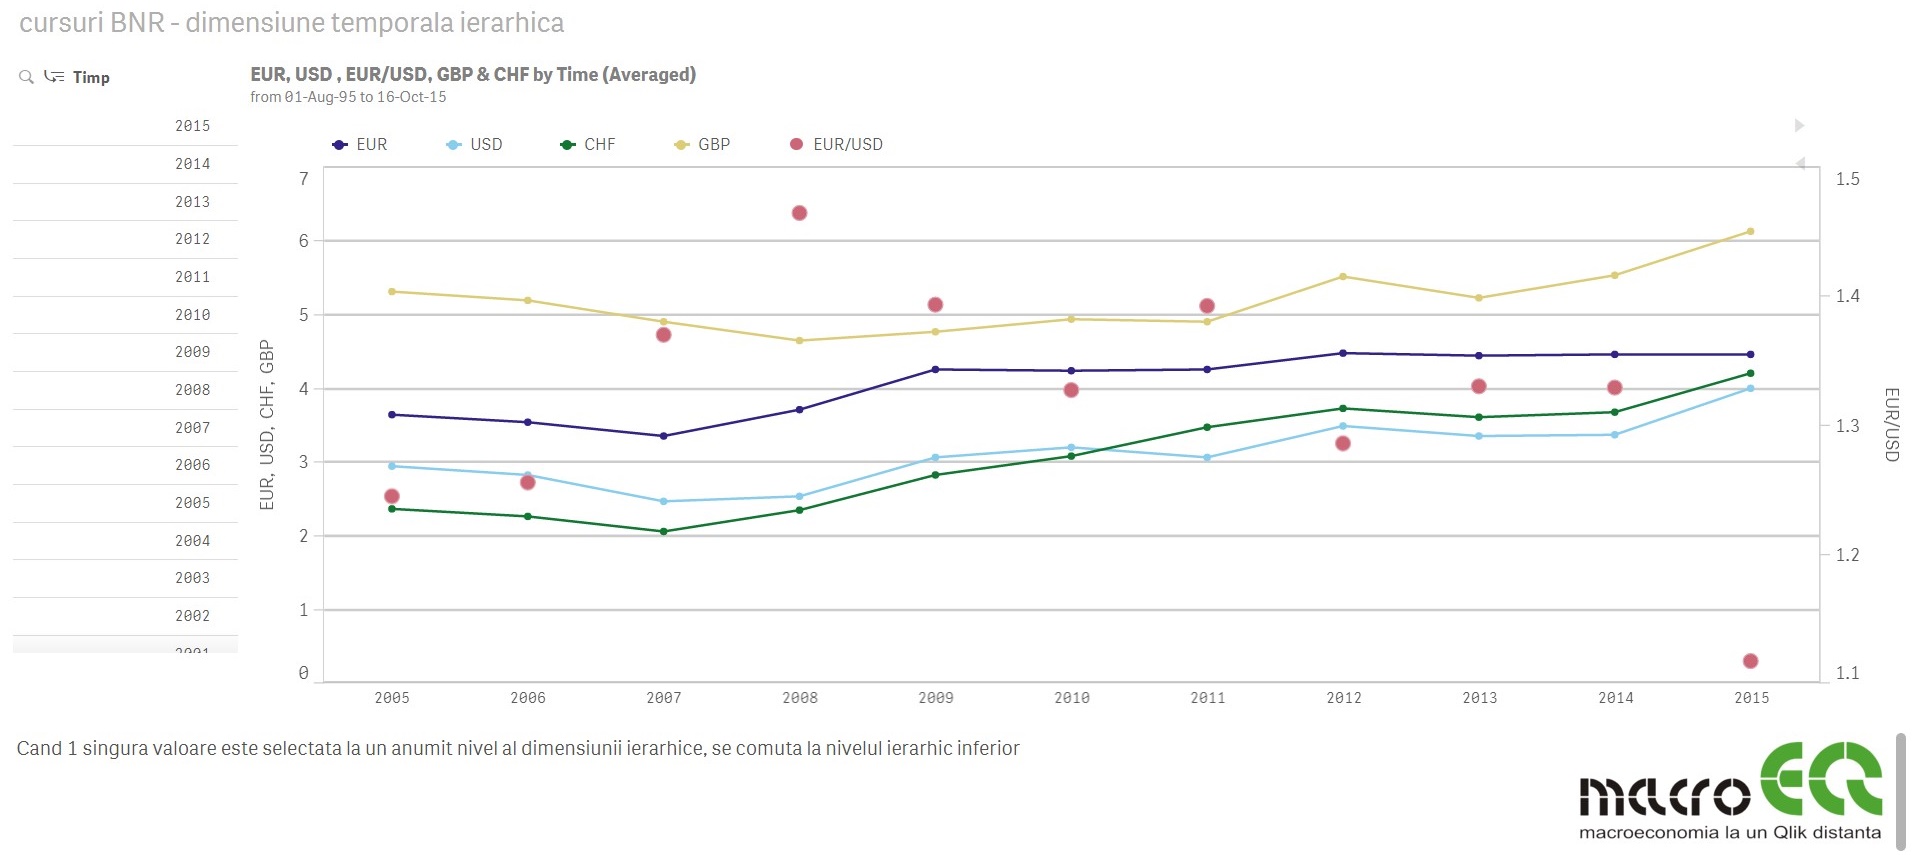
An example of an application that was made using macroEQ is the one about currency exchange rates. In this application you can view the following:
A. The evolution of the main currencies over time (RON, EUR, USD, CHF, GBP);
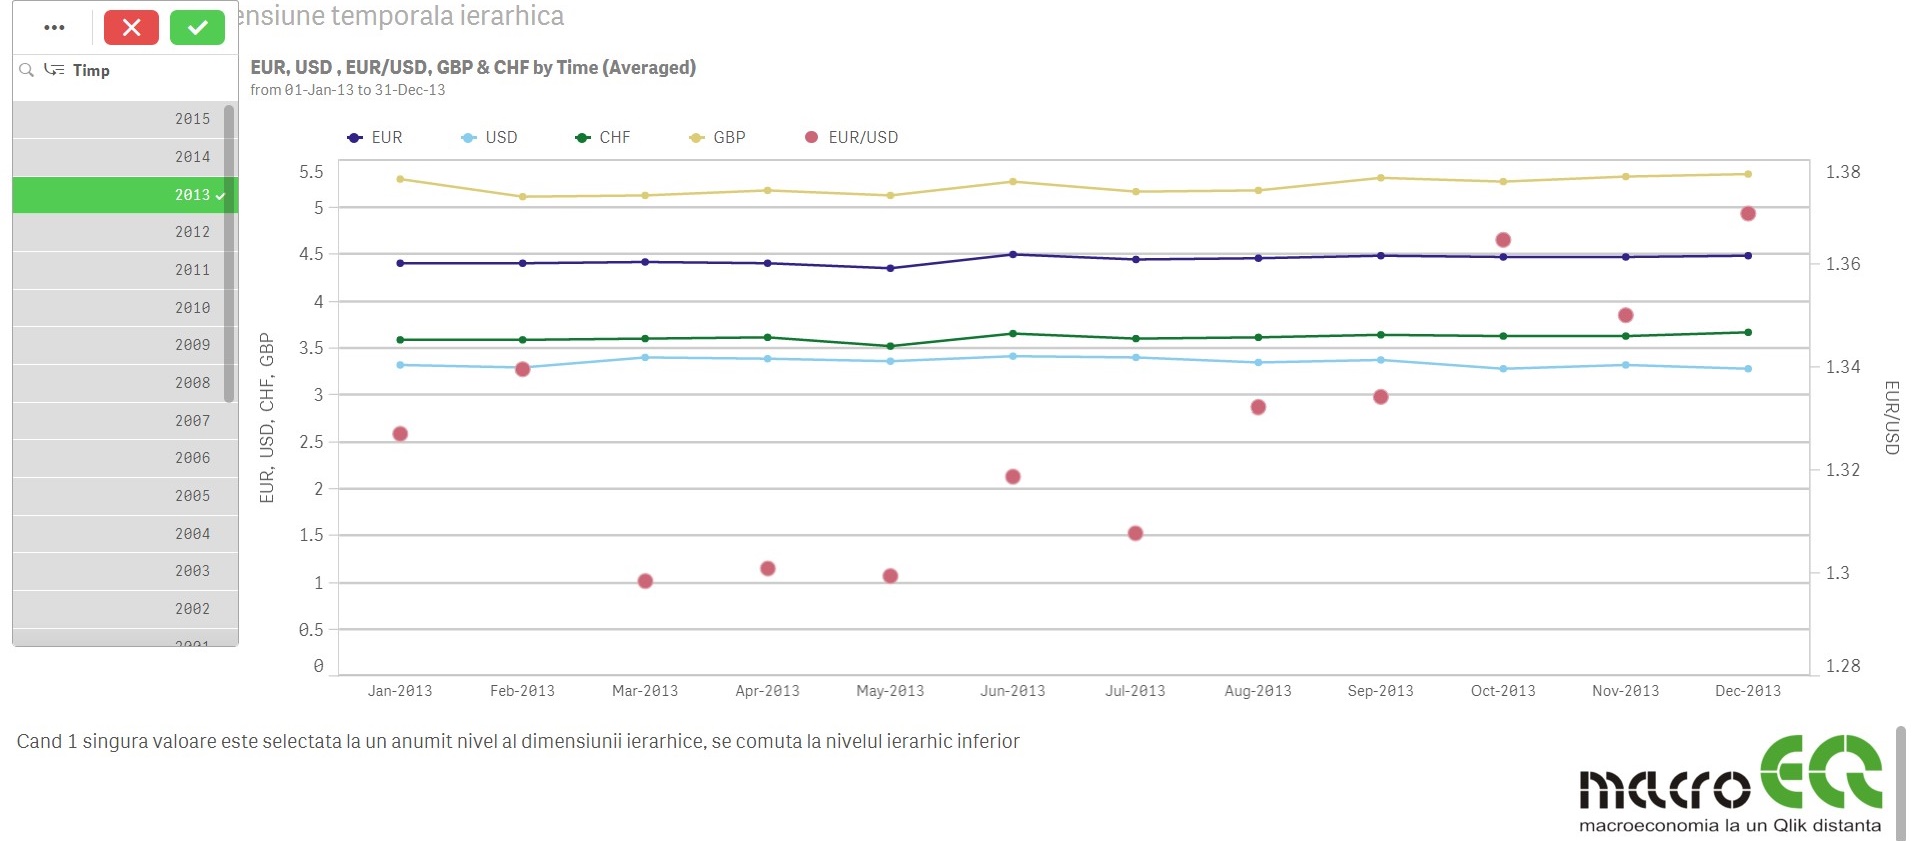
Initially, the graph shows the averages of these currencies (RON, EUR, USD, CHF, GBP) per years.
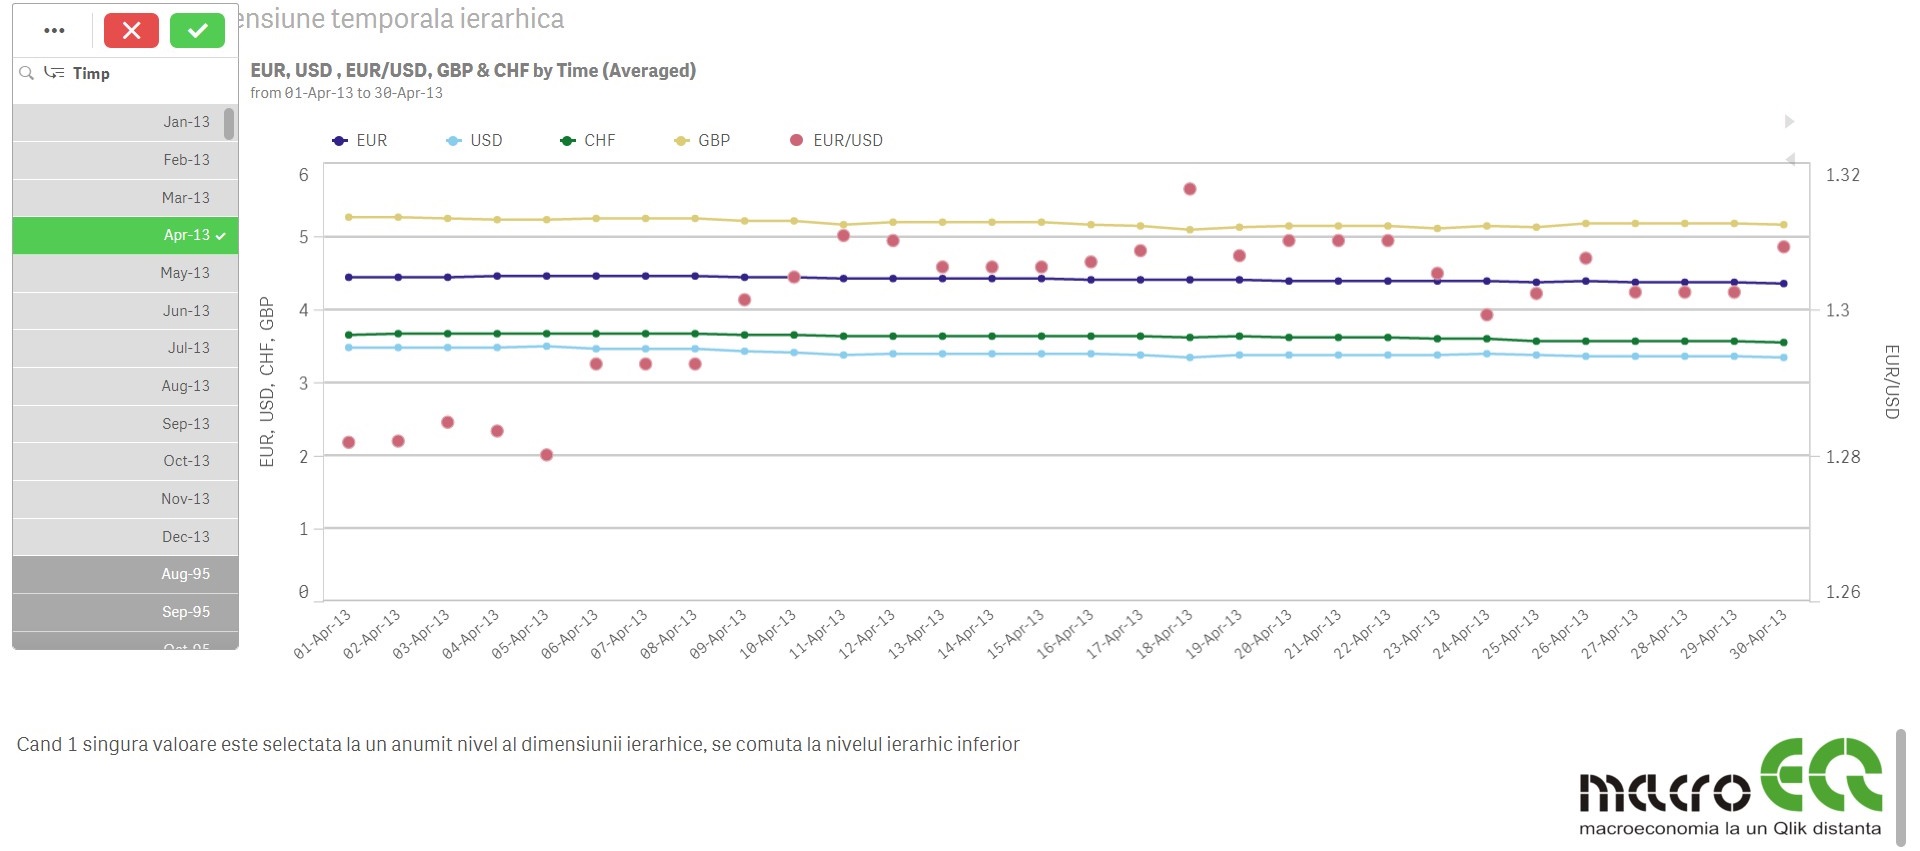
By selecting a year, from the left side of the view (in the example above, 2013 was selected), this average is recalculated at month level, and if one month is selected (also on the left side of the view) Could view the exchange rates of each day of that month (as can be seen in the picture below).
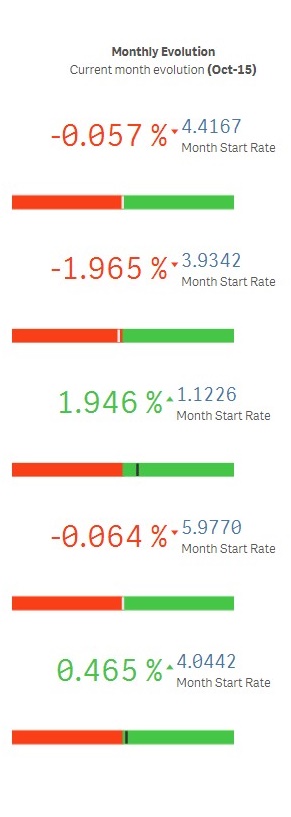
B. The parity between different currencies, for the current date, with the possibility of recalculation for another selected date.
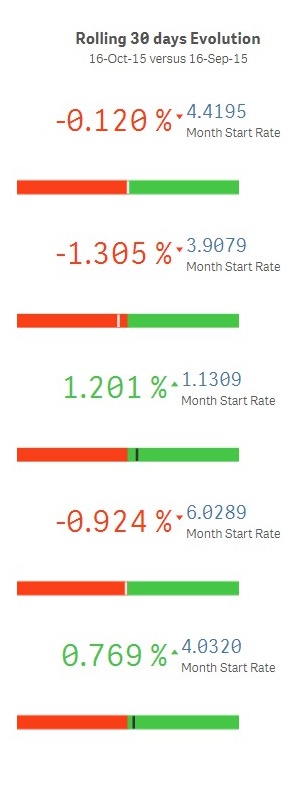
Appreciation or depreciation of different currencies – the reports are presented for the end of the month versus the beginning of the selected month.
Rotation 30-day and evolution – the ratio between the current or selected date and the same report calculated 30 days ago.
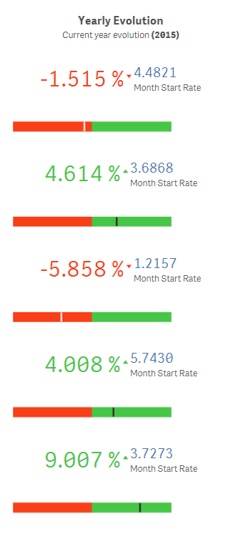
The appreciation or depreciation of different currencies – the ratio between the current or selected date and the same ratio calculated at the beginning of that year.
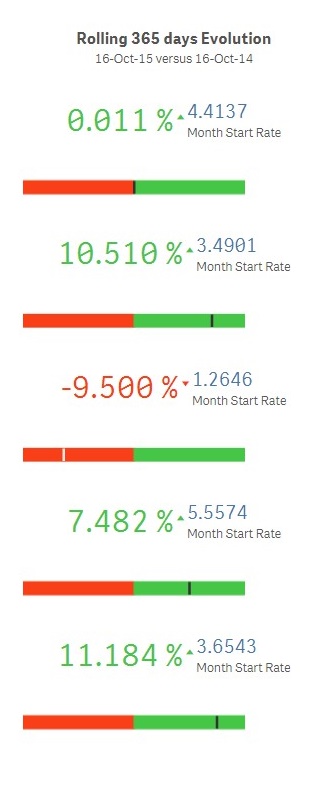
Rotation and 1-year evolution – the ratio between the current or selected date and the same report calculated 365 days ago.
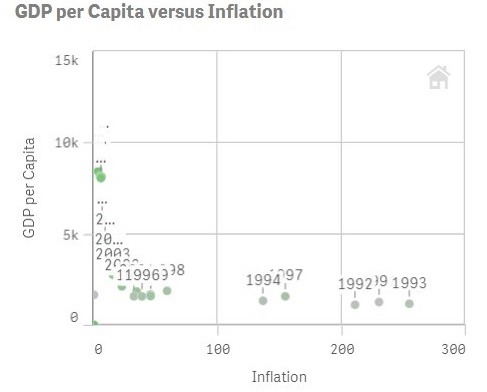
C. Situations that show the evolution of income per capita over a period of time, the evolution of inflation and unemployment.
Bi-dimensional Survey Income per capita vs. Inflation – presents the annual evolution of the population’s incomes, based on the calculated and recorded inflation index.
Bi-Dimensional Analysis Inflation vs. Unemployment – shows the consistency between the annual inflation index and the number of unemployed.
The higher the inflation, the higher the number of unemployed people.
If you are interested in macroEQ™ product, please fill in the form here!
In order to be in touch with the latest news in the field, unique solutions explained, but also with our personal perspectives regarding the world of management, data and analytics, we recommend the QQblog !
This website uses cookies to improve your experience. We'll assume you're ok with this, but you can opt-out if you wish.AcceptRejectRead More
Privacy & Cookies Policy
Privacy Overview
This website uses cookies to improve your experience while you navigate through the website. Out of these, the cookies that are categorized as necessary are stored on your browser as they are essential for the working of basic functionalities of the website. We also use third-party cookies that help us analyze and understand how you use this website. These cookies will be stored in your browser only with your consent. You also have the option to opt-out of these cookies. But opting out of some of these cookies may affect your browsing experience.
Necessary cookies are absolutely essential for the website to function properly. This category only includes cookies that ensures basic functionalities and security features of the website. These cookies do not store any personal information.
Any cookies that may not be particularly necessary for the website to function and is used specifically to collect user personal data via analytics, ads, other embedded contents are termed as non-necessary cookies. It is mandatory to procure user consent prior to running these cookies on your website.